

In this blog post, we'll show you how to create separate reports for one or more members of a POV dimension in an ad hoc report using Cascade option in Oracle Smart View. Cascading your ad hoc report will automatically generate reports across separate worksheets of an Excel workbook; in other words, a worksheet is created for each POV dimension member.
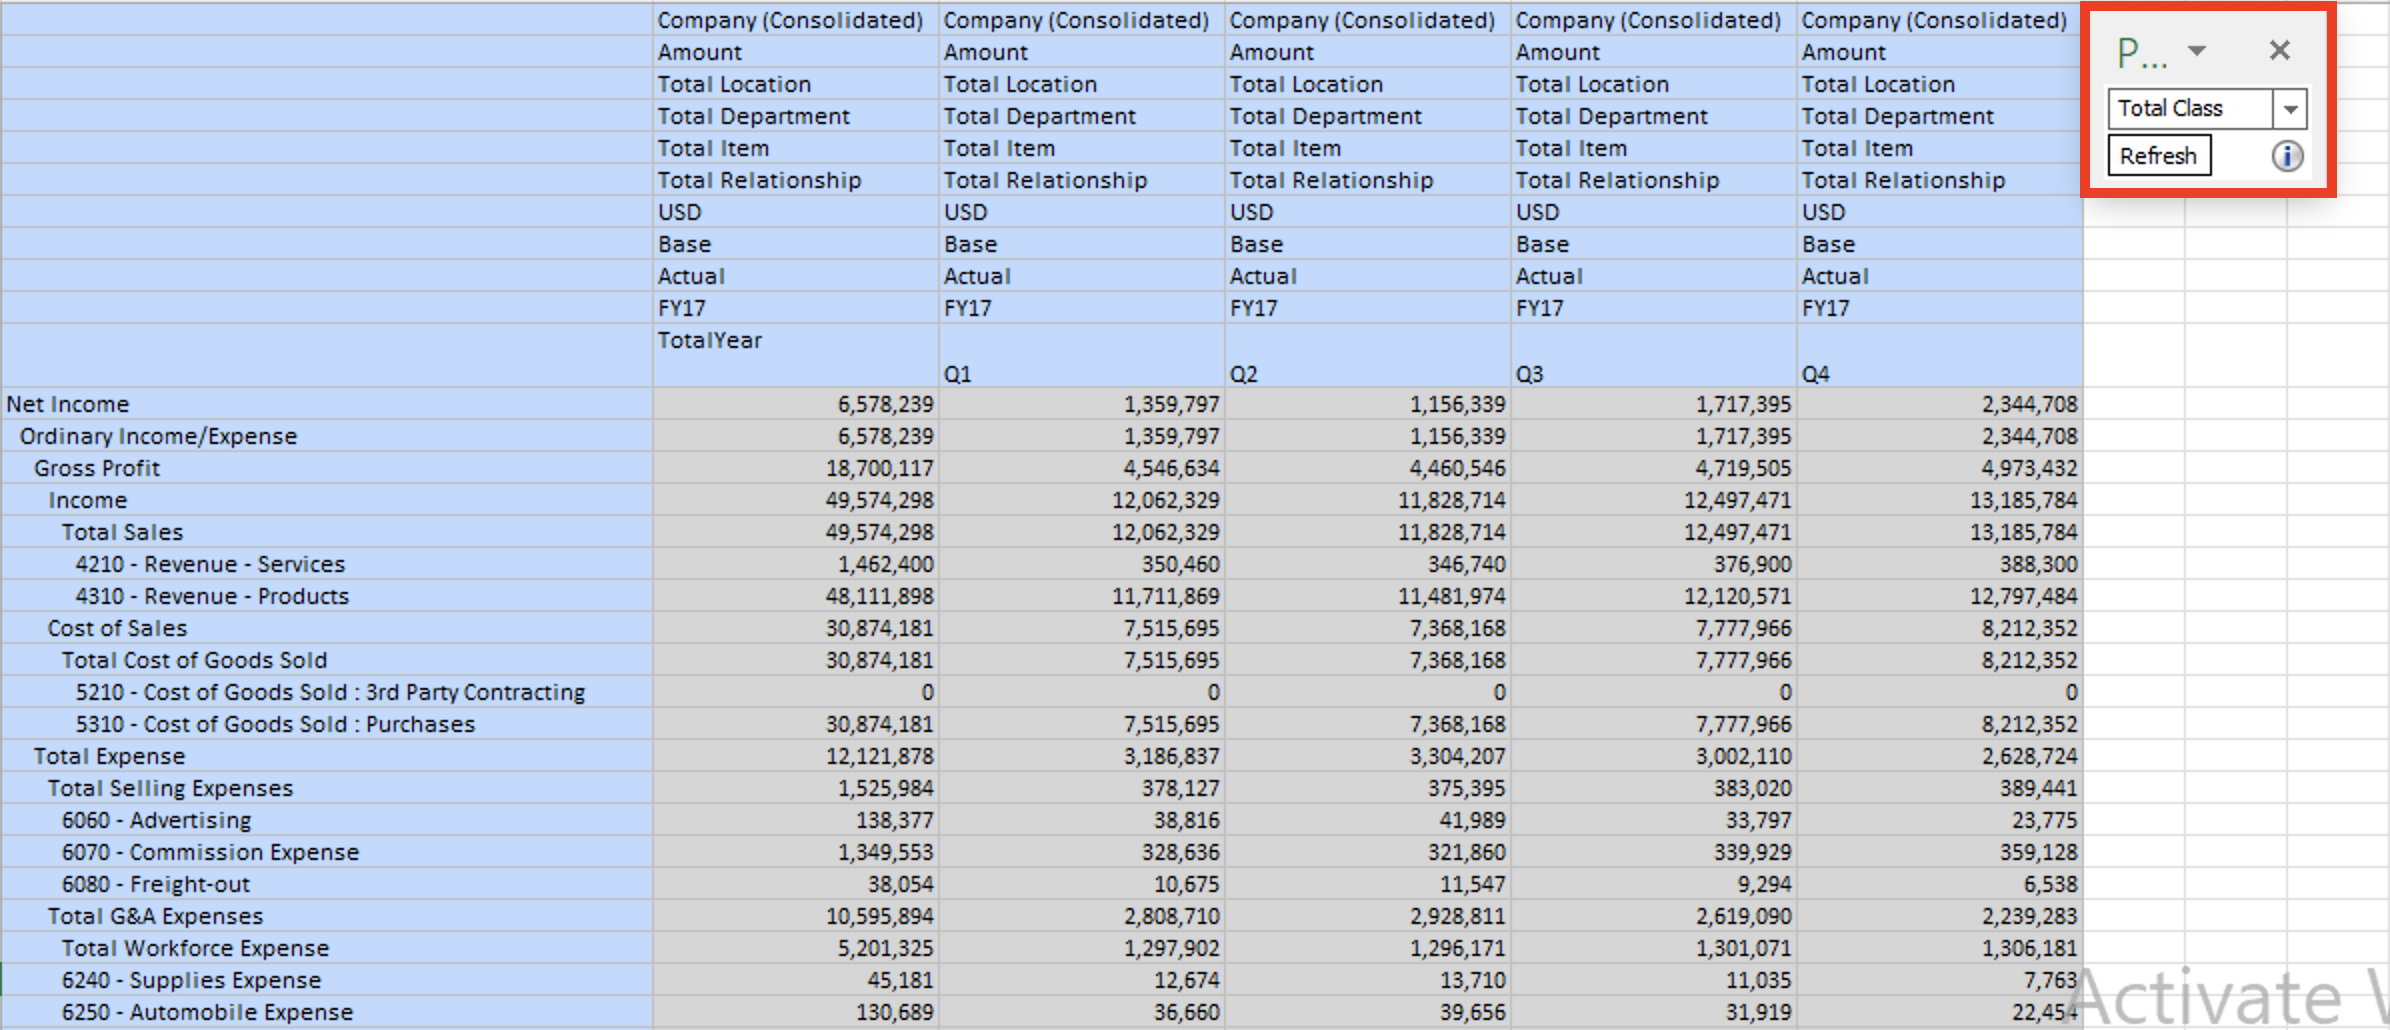
In the example below, we have an ad hoc grid that displays income statement report by Total Class. Let's say you want to produce additional Income Statement reports by specific class. Instead of recreating or duplicating your report for each class, which can be very time consuming, you can leverage Cascade option to create these reports in a matter of seconds. Let's cascade our ad hoc grid so that the income statement reports are displayed by specific class in the current workbook.
1. Notice that Class dimension is sitting in the POV toolbar. Common practice is to bring the dimension that you want to cascade the reports from in the POV.
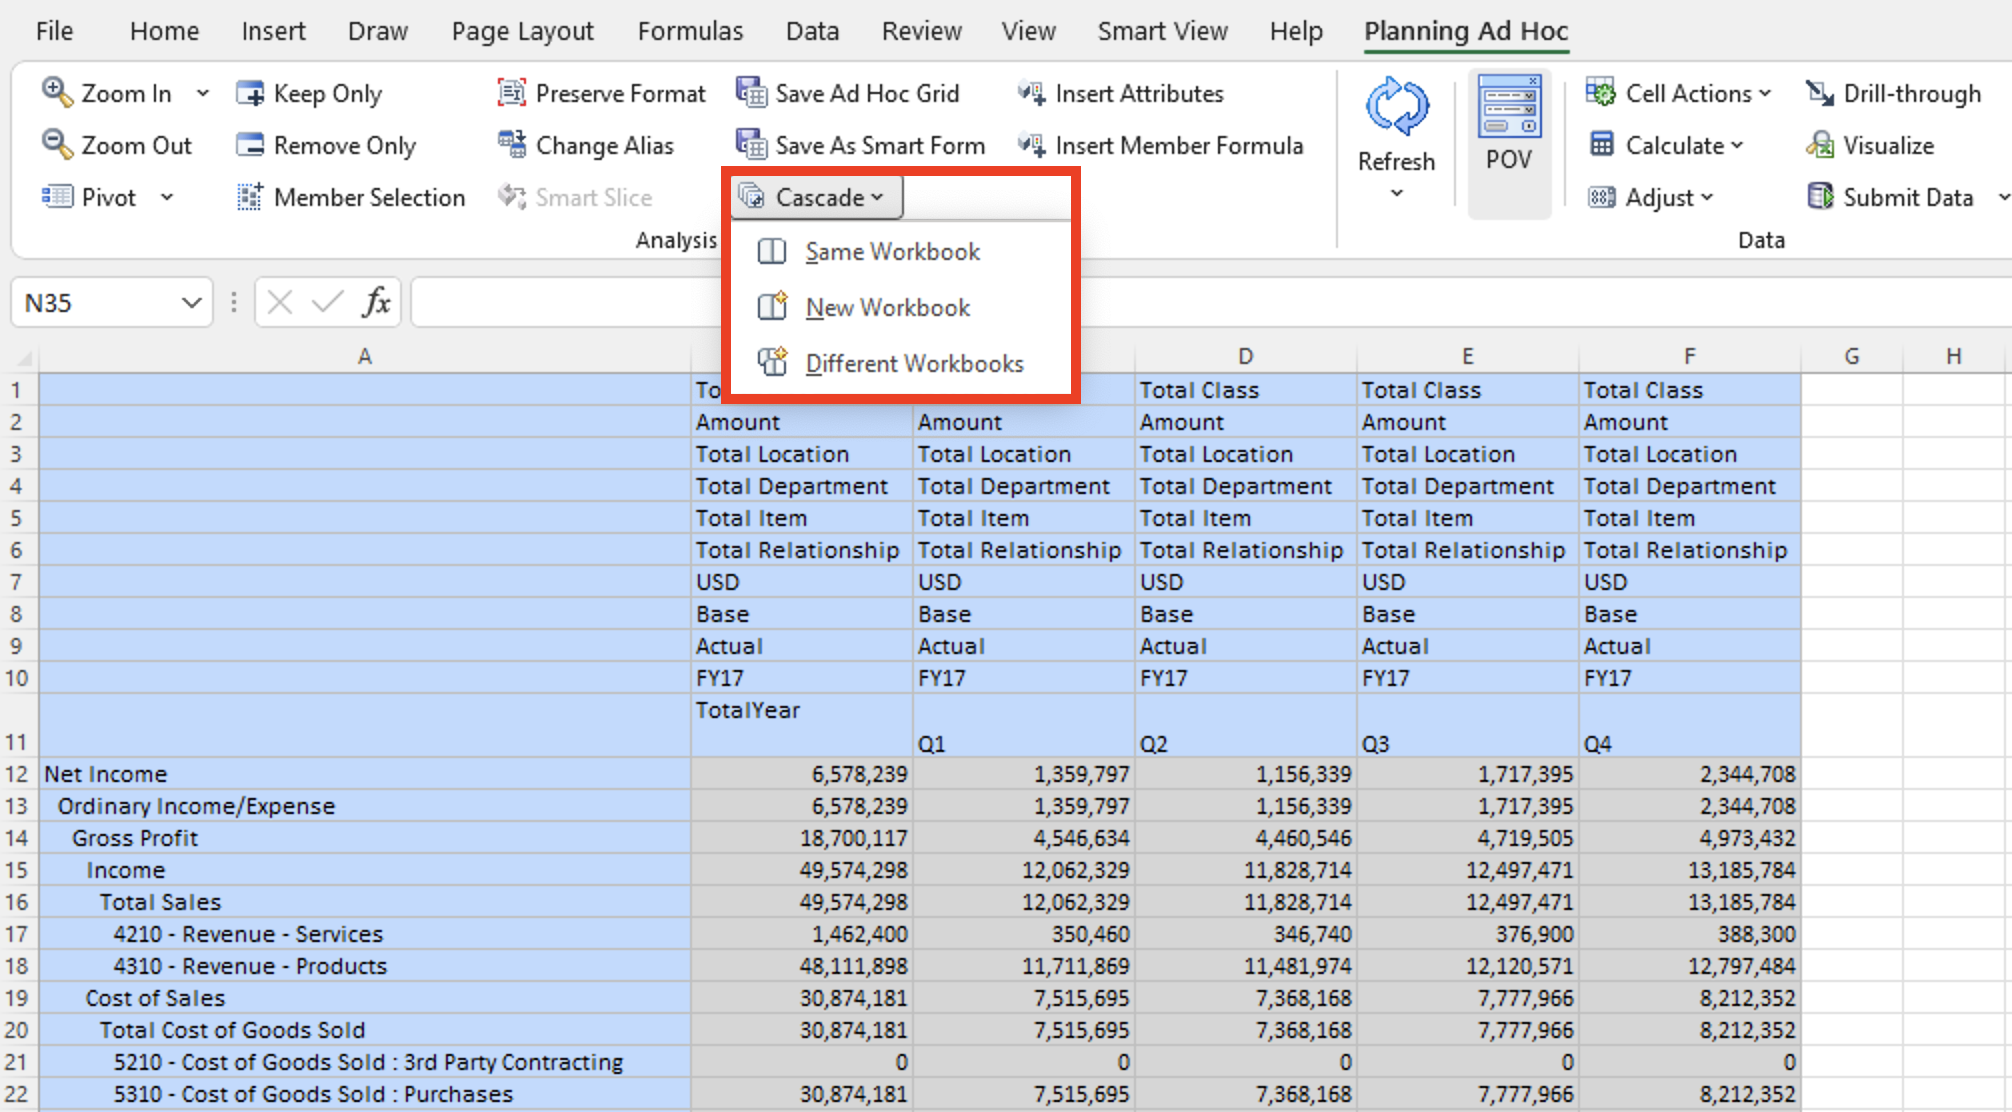
2. On the Planning Ad Hoc ribbon, select the drop-down arrow to the right of Cascade, and then select one of the following cascade options:
- Same Workbook: to cascade new worksheets to the current workbook
- New Workbook: to cascade new worksheets to a new workbook
- Different Workbooks: to cascade each worksheet to a different workbook
In this example, let's select Same Workbook to cascade new Income Statement reports by Class to the current workbook.
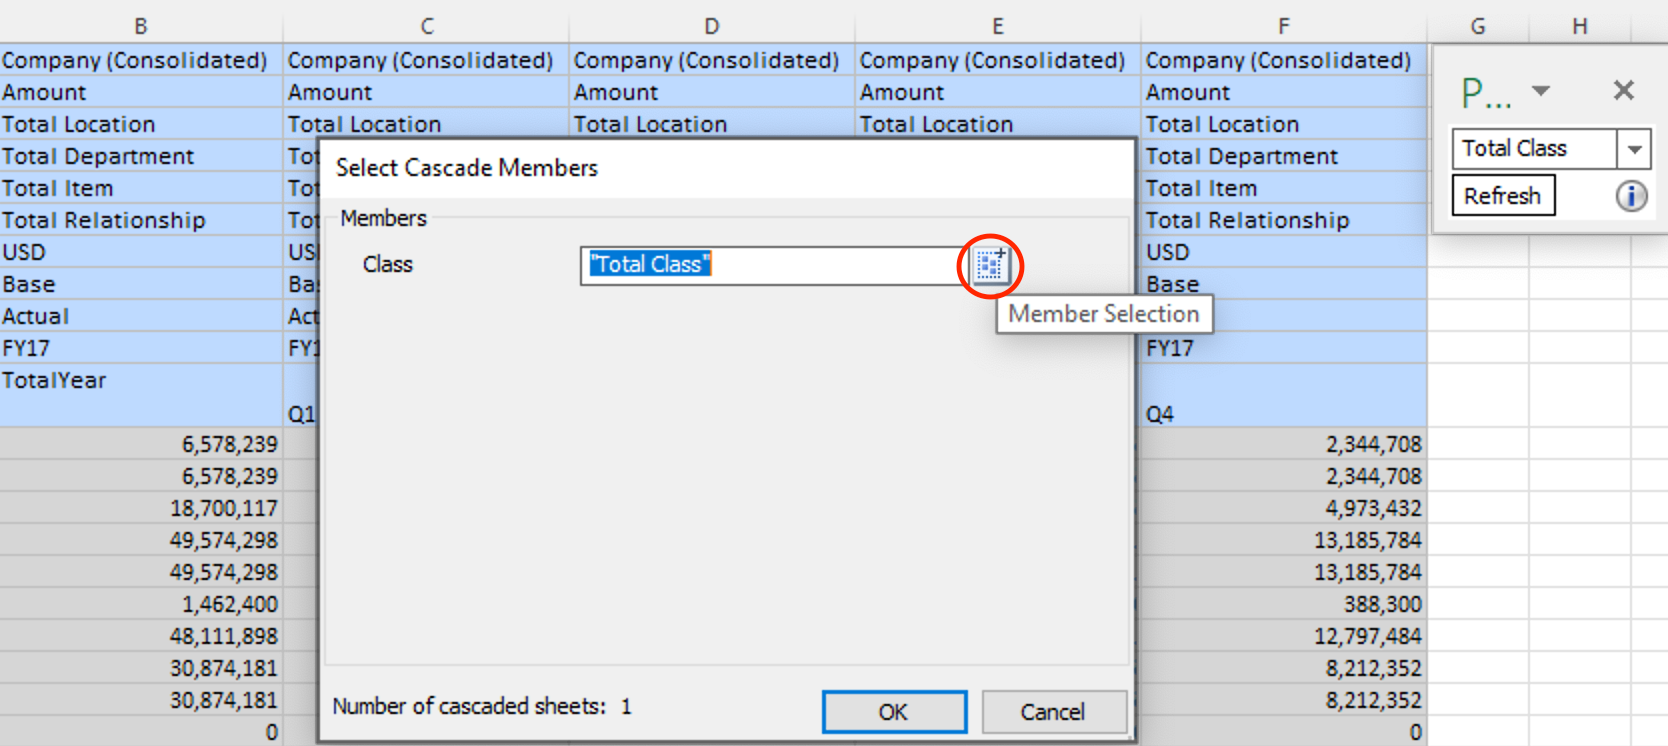
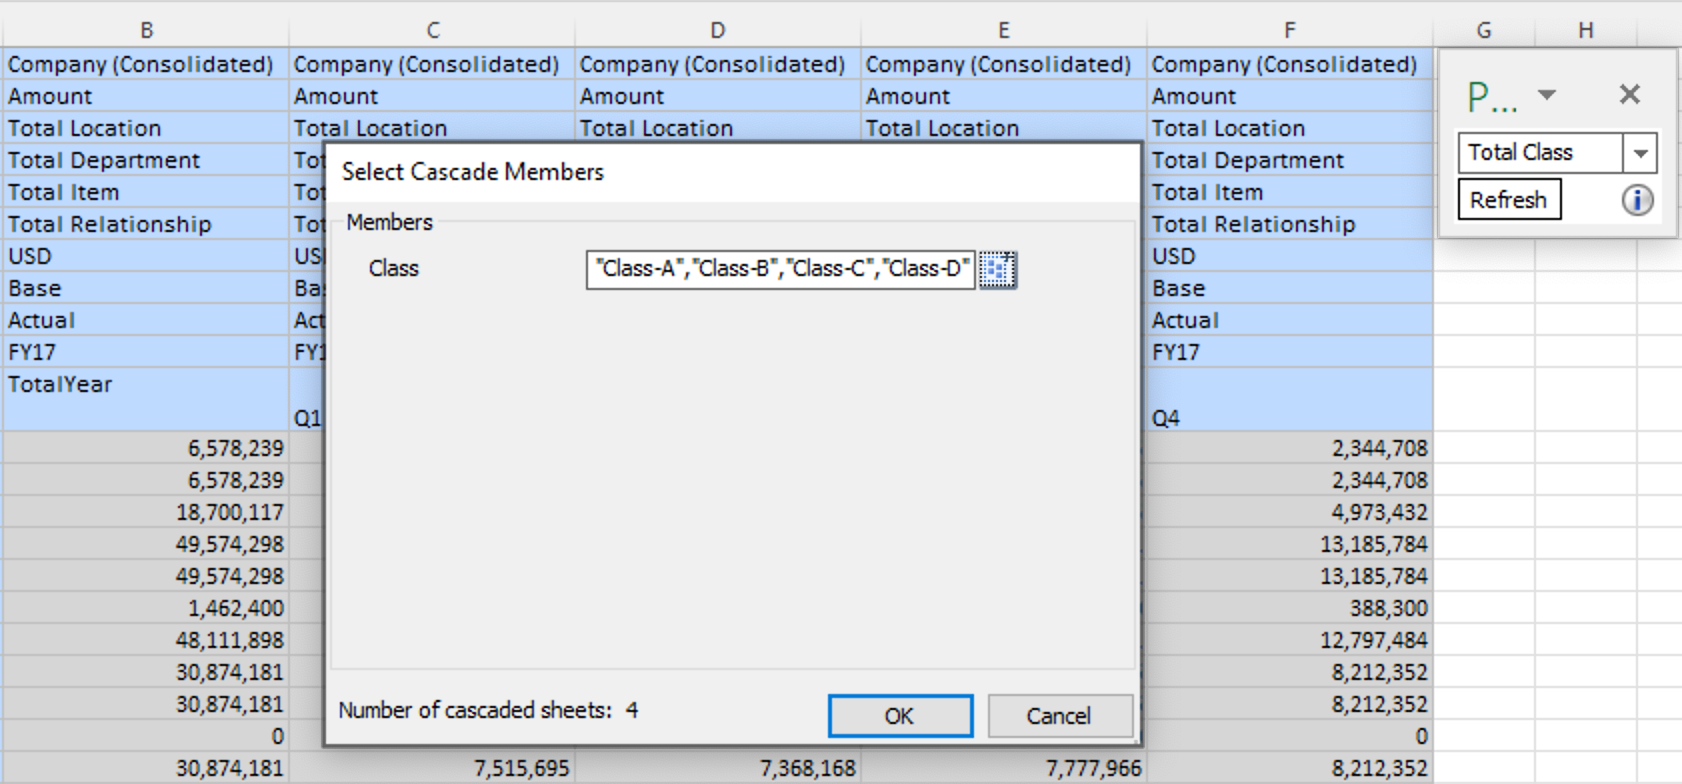
3. Because Class is the only dimension in the POV, it will be used as the basis for the report. Click Member Selection icon.
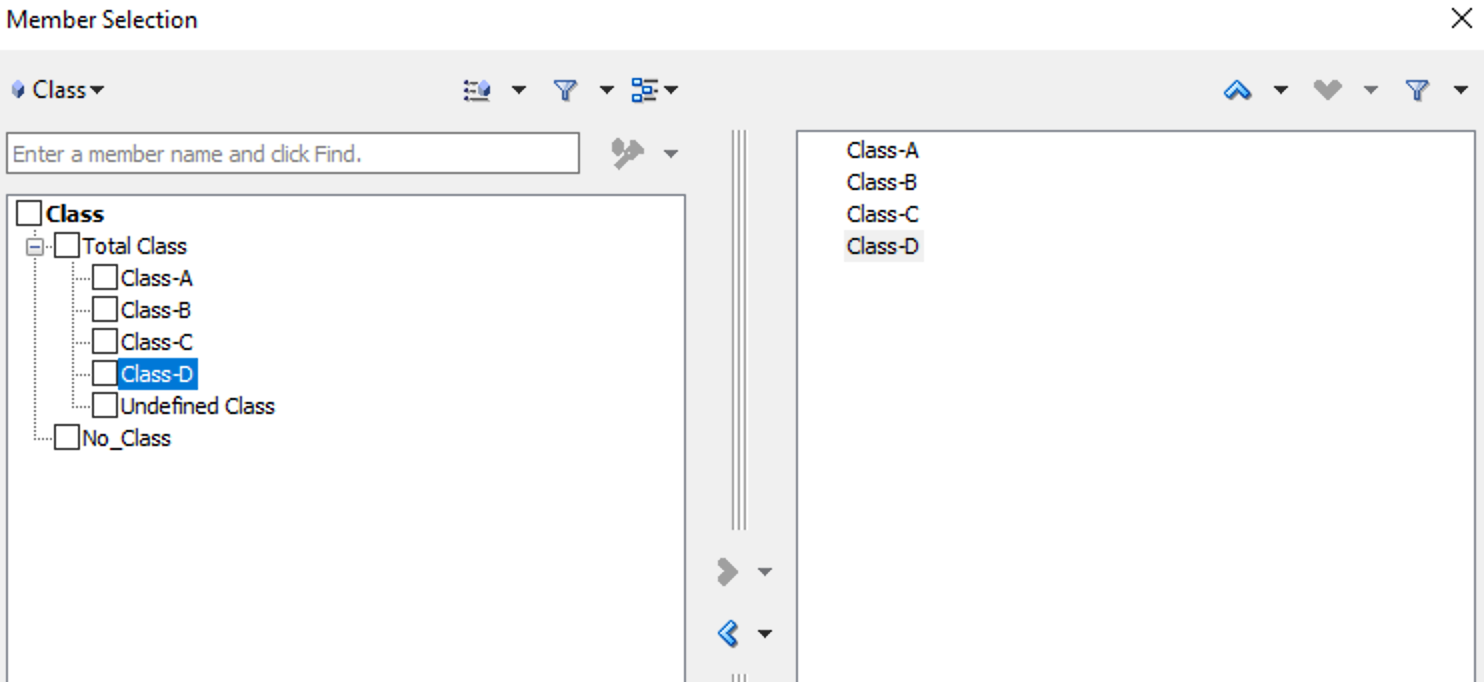
4. Select members of the Class dimension for which you want to create reports. In this example, let's create reports for each of the classes listed, excepted for Undefined Class. One report will be generated for each member, or in this case each class, you select.
5. Click OK to begin cascading. Notice the number of cascaded sheets increases from 1 to 4, indicating that Smart View will create 4 new reports based on the classes you have selected.
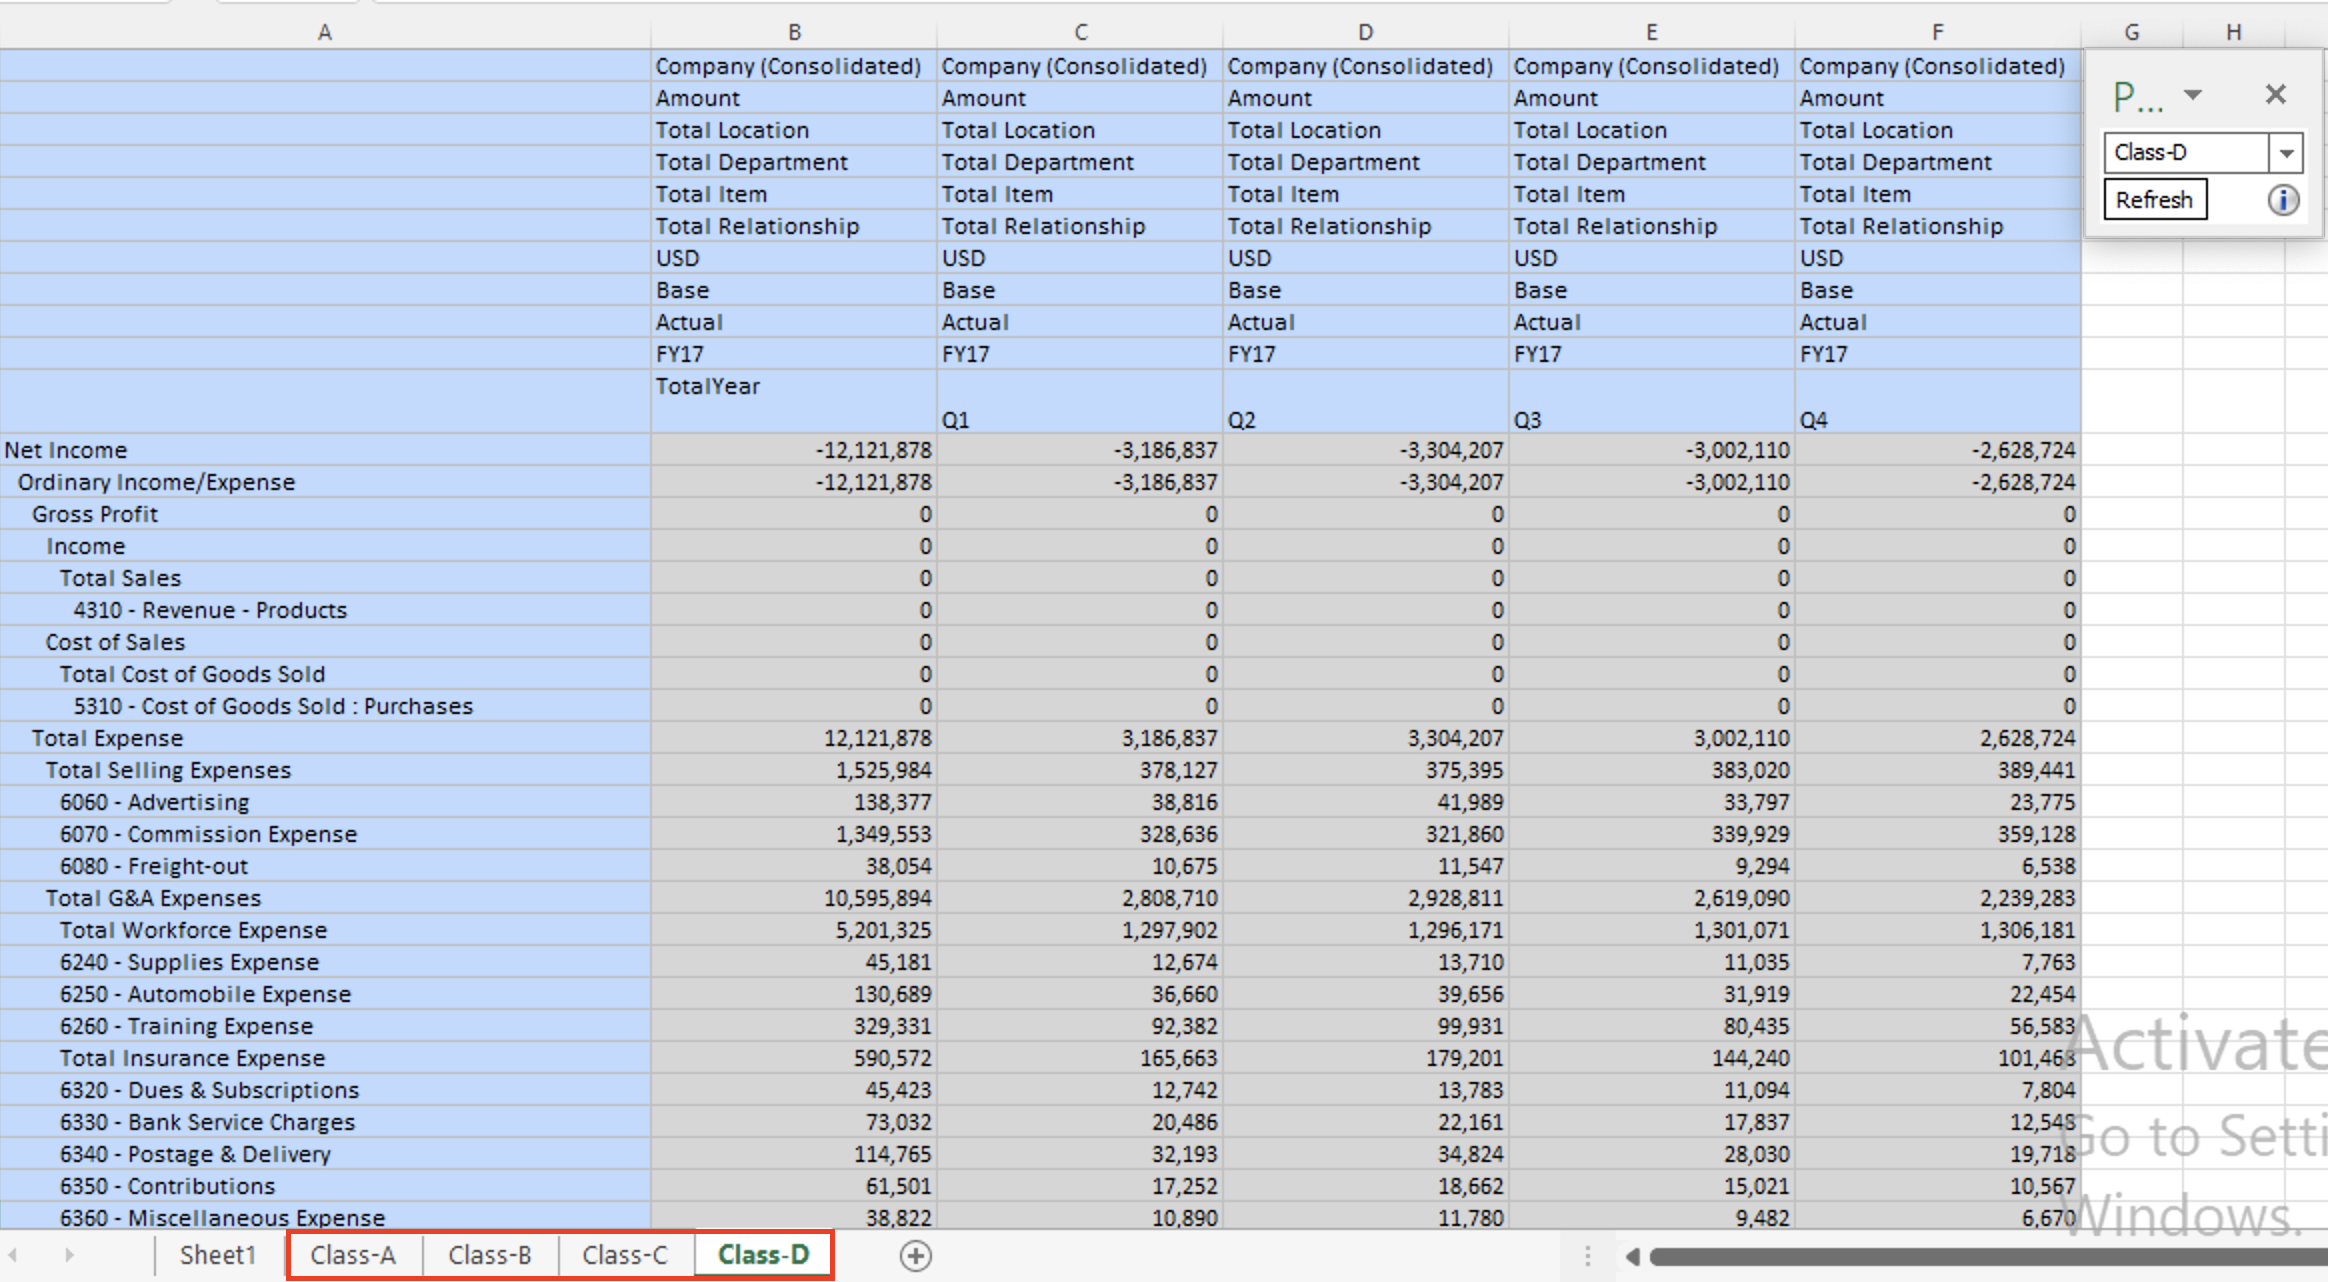
6. Depending on your cascade selection, the resulting reports are cascaded on separate worksheets in the current workbook or in a new one. In this example, each worksheet tab is named after the POV dimension member that the report contains. Four cascaded worksheets are created separately for Class-A, Class-B, Class-C and Class-D in the same workbook as the original Income Statement by Total Class (Sheet1).
Note:
- To enable worksheet tab naming, do not use more than 31 characters or any the following characters for dimension or member names: ( ) : \ / ? * [ ].
- Cascading may be slow for large grids.
- When extensions are enabled in Smart View, cascading a report with a large number of members can cause Excel to stop responding. You may disable any extensions that are installed from the Smart View Options dialog box, Extensions tab. After disabling, restart Excel and repeat the cascade operation.
Want to Learn More?
If you would like a free consultation please contact Gerard at Redhill Business Analytics via email or the contact form below.