

In this post, we'll show you how to use Ad Hoc Options in Smart View to customize your ad-hoc reports. If you are not familiar with setting up a basic ad-hoc report, check out our post on Creating Ad Hoc Report in Smart View.
Options menu in Smart View allows you to control how ad hoc actions are performed and how grids are displayed in your excel worksheets. There are two types of options: global options and sheet options. We'll review both types in this blog post today.
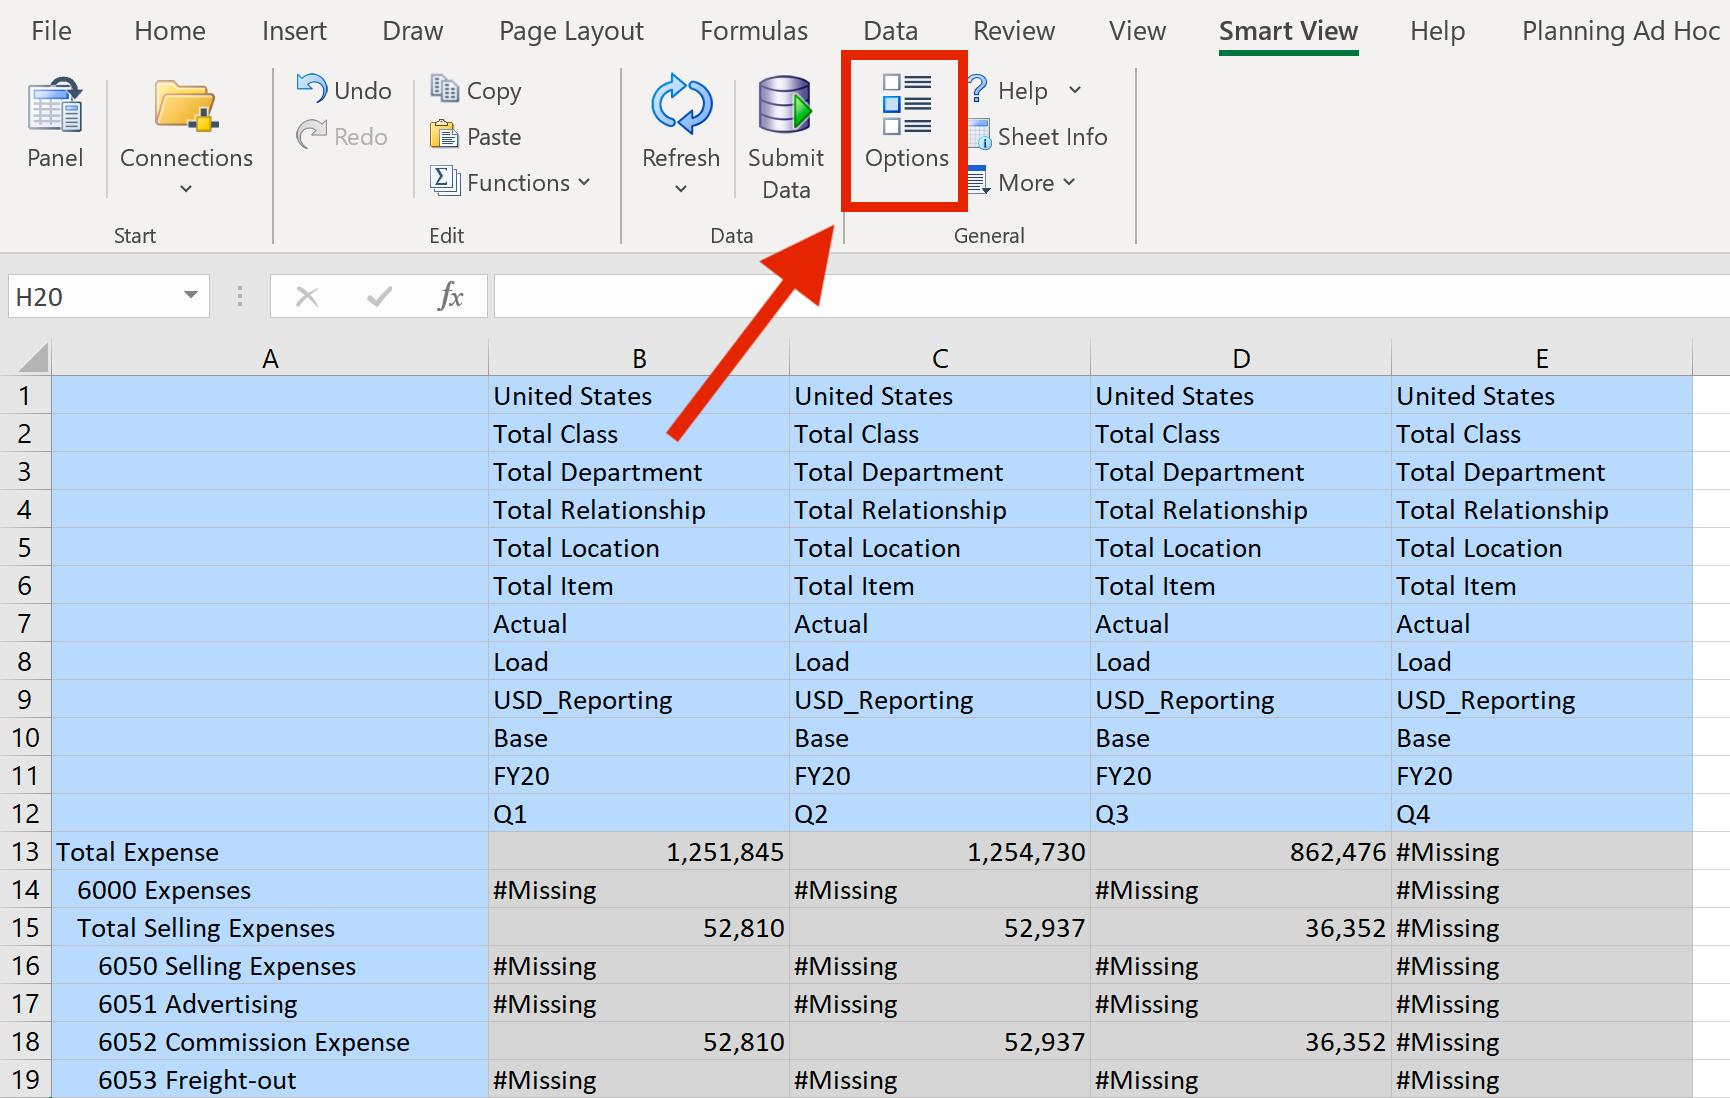
To access Options menu, you must be connected to Smart View first. Then navigate to the Options dialog box from the Smart View ribbon.
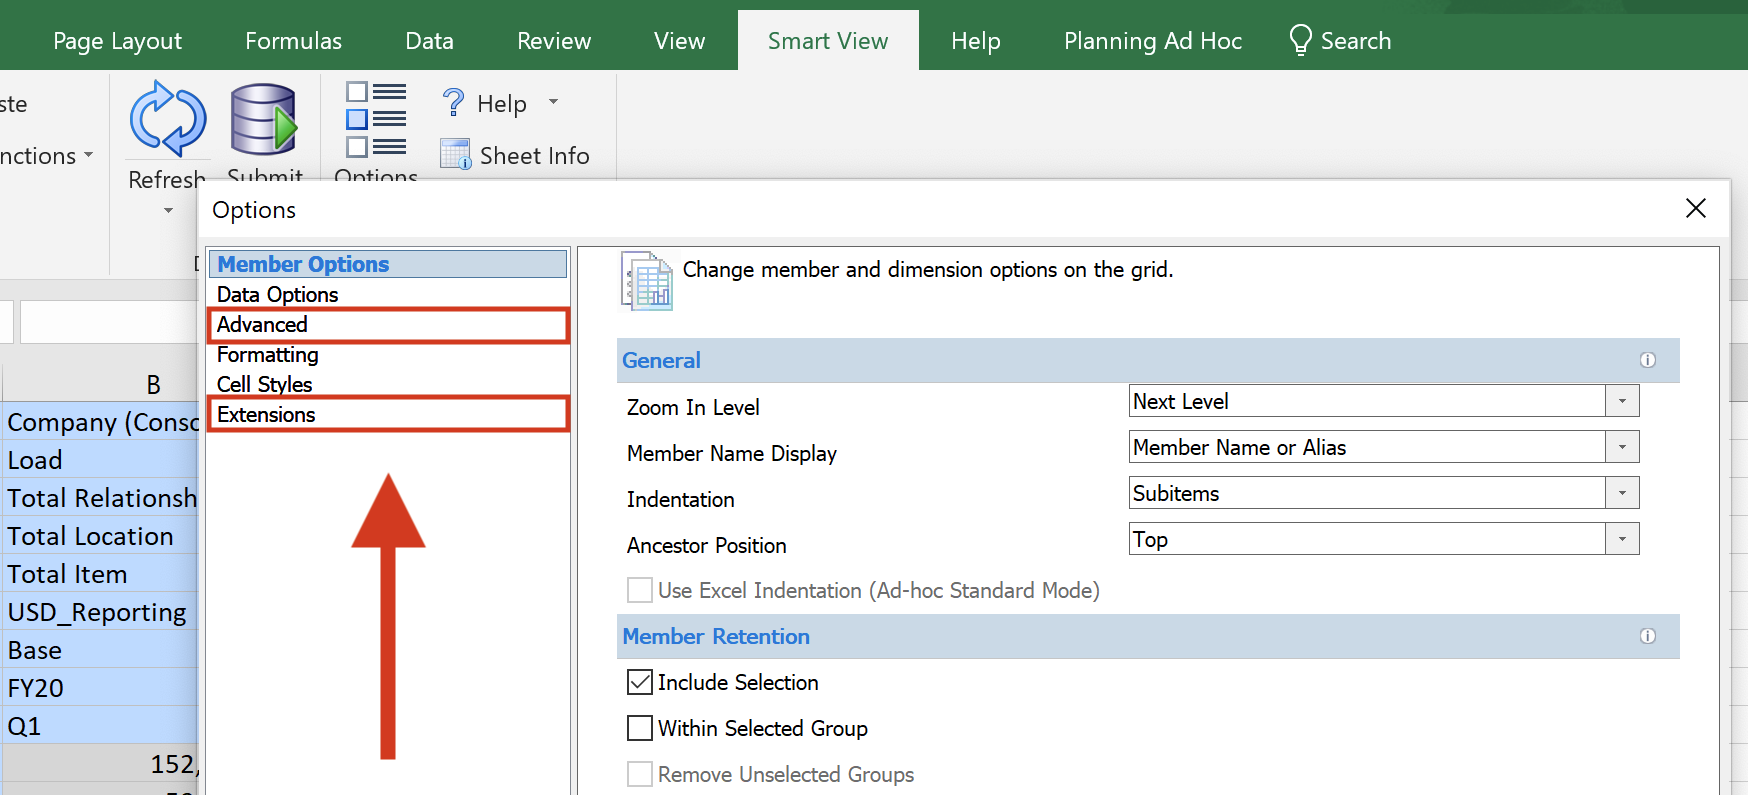
Global options are set in Advanced and Extensions option menus. Please note that global options apply to all workbooks and worksheets, including the current ones and those that you later create. Let's take a look at each of these global options.
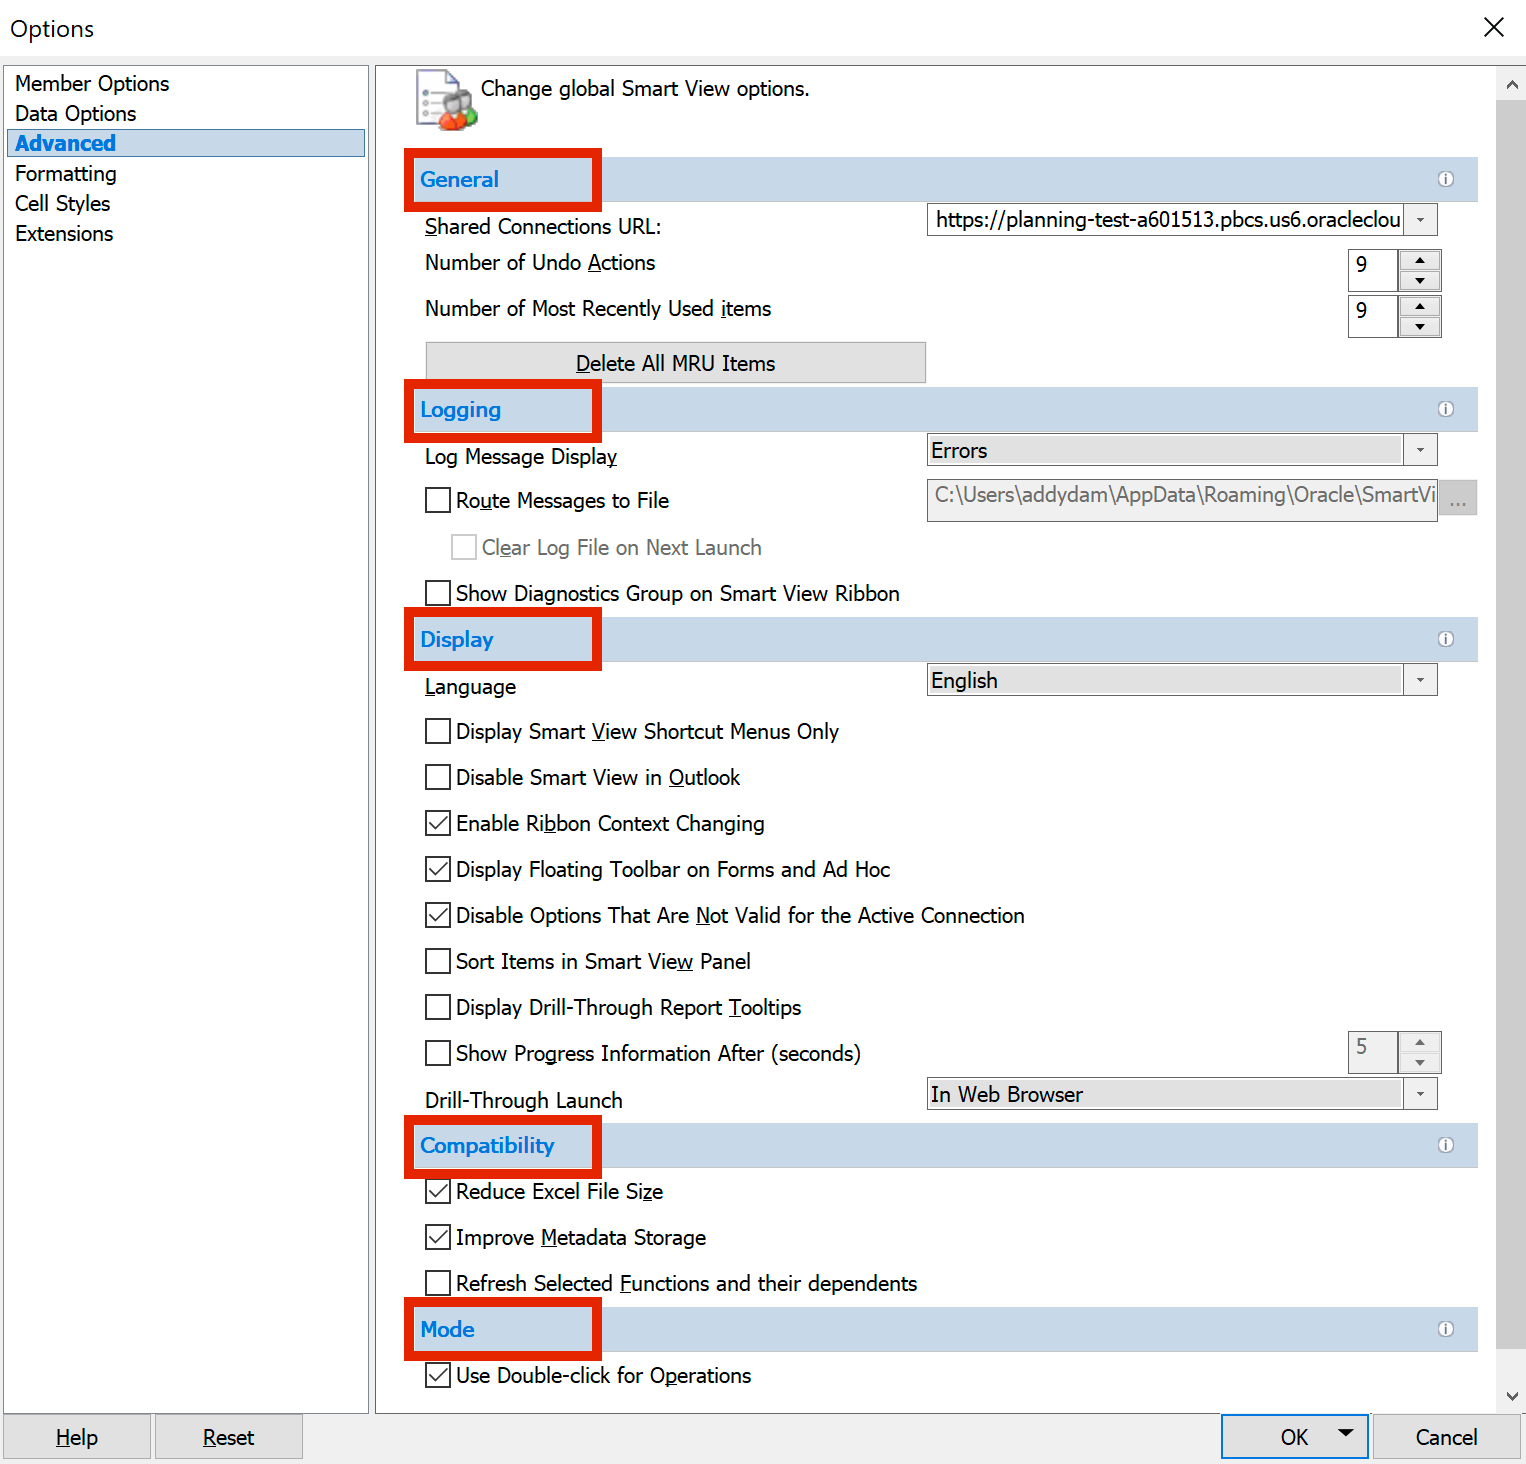
- Advanced: this is where you specify general actions and set options for logging, display, compatibility, and mode. Remember in our How to Configure a Shared Connection in Smart View blog post, we need to enter the shared connection URL in the General section to connect Smart View sheet to an EPM data source.
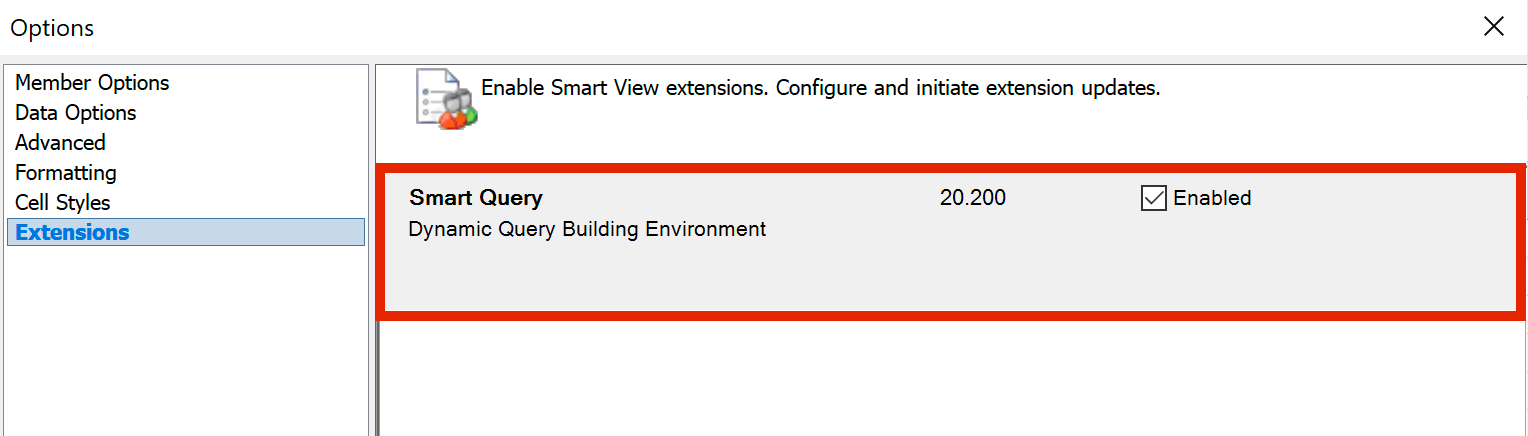
2. Extensions: this is where you can see a list of the extensions you can use to leverage Smart View functionality.
Aside from Global options, Sheet options are set in Members Options, Data Options, and Formatting. Sheet options are specified for worksheets and are usually the default option for new worksheets in the current and new workbooks. However, keep in mind that changes that you make to sheet-level settings do not affect existing worksheets or workbooks. Let's look at each of the sheet options below.
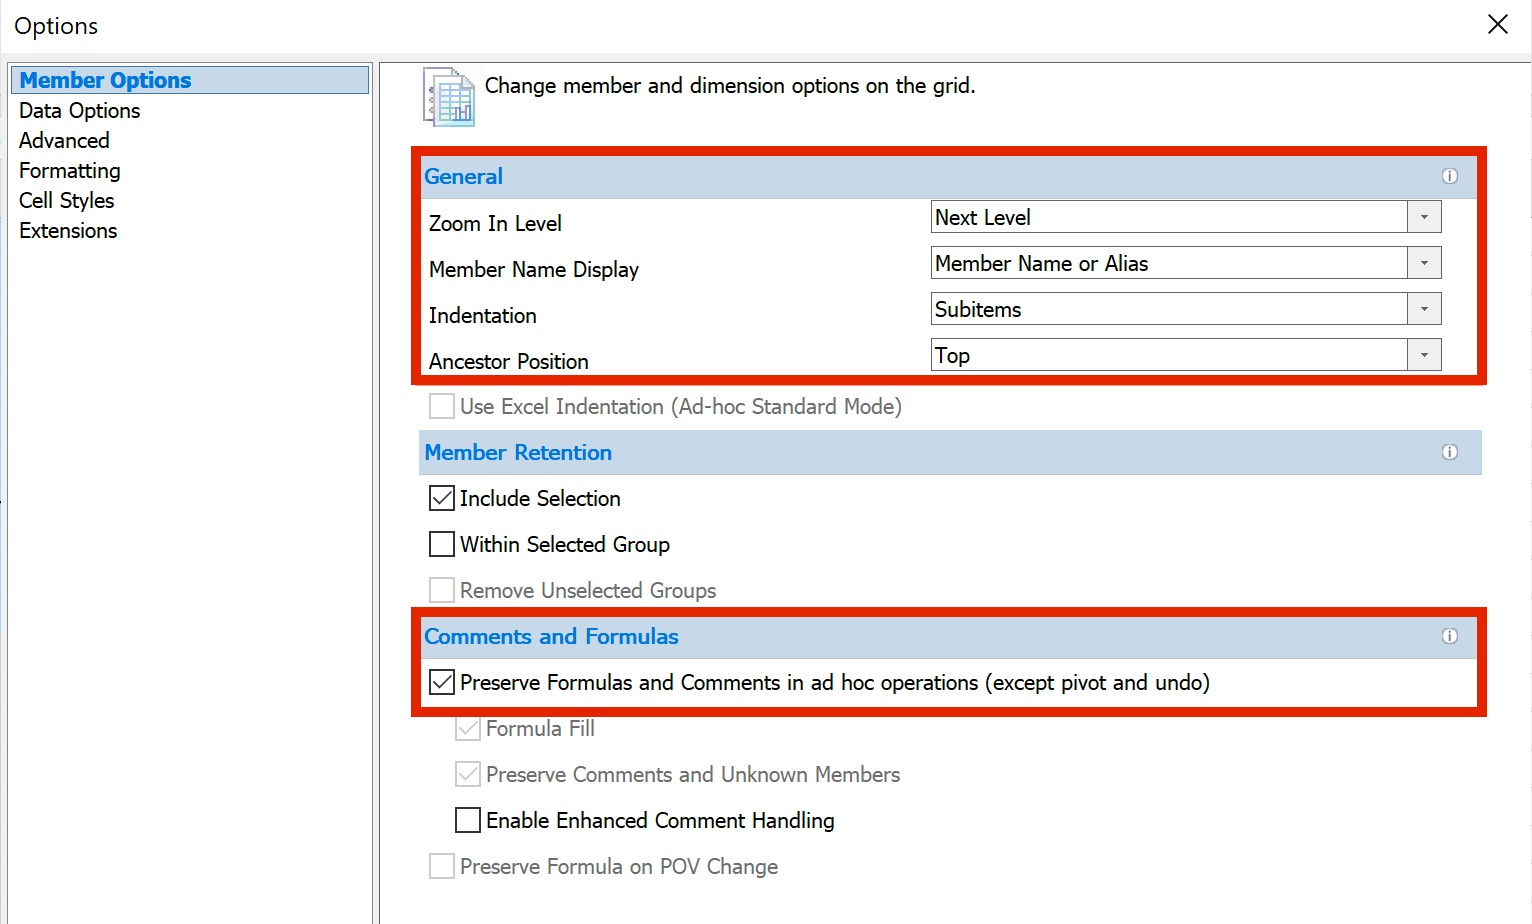
3. Members Options: this is where you specify how member and dimension cells are displayed in the ad hoc grids. You can choose to whether to zoom in next level, all levels, or bottom level when double clicking the Zoom In button in Smart View ribbon. In addition, you can specify whether an ancestor member is displayed on the top or the bottom of the hierarchy (the default is Top), whether the hierarchy levels are indented (the default is Subitems), and whether to preserve formulas and comments while you perform ad hoc operations.
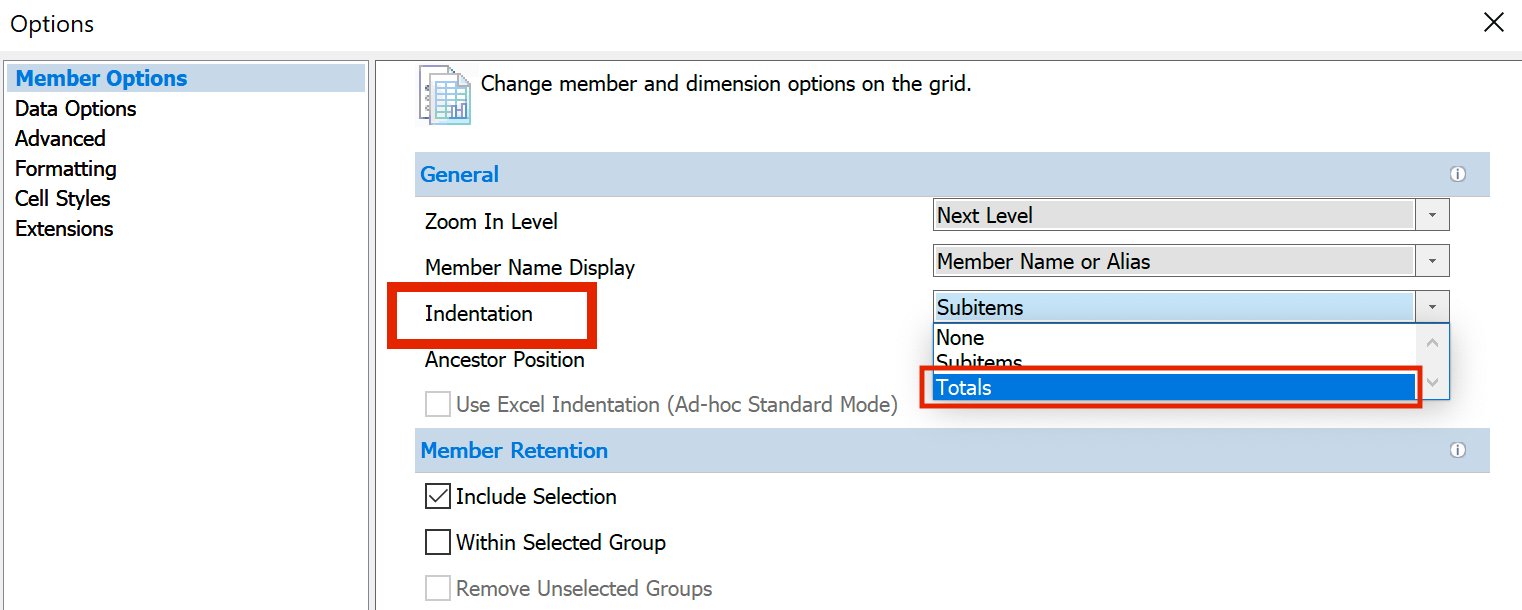
In the example below, let's say we have Total Expense and its descendants displayed in ad hoc grid and we want to indent parent-level members. From Member Options dialog box, toggle the Indentation option to Totals to see the totals indented instead of the subitems. Click OK and refresh the worksheet.
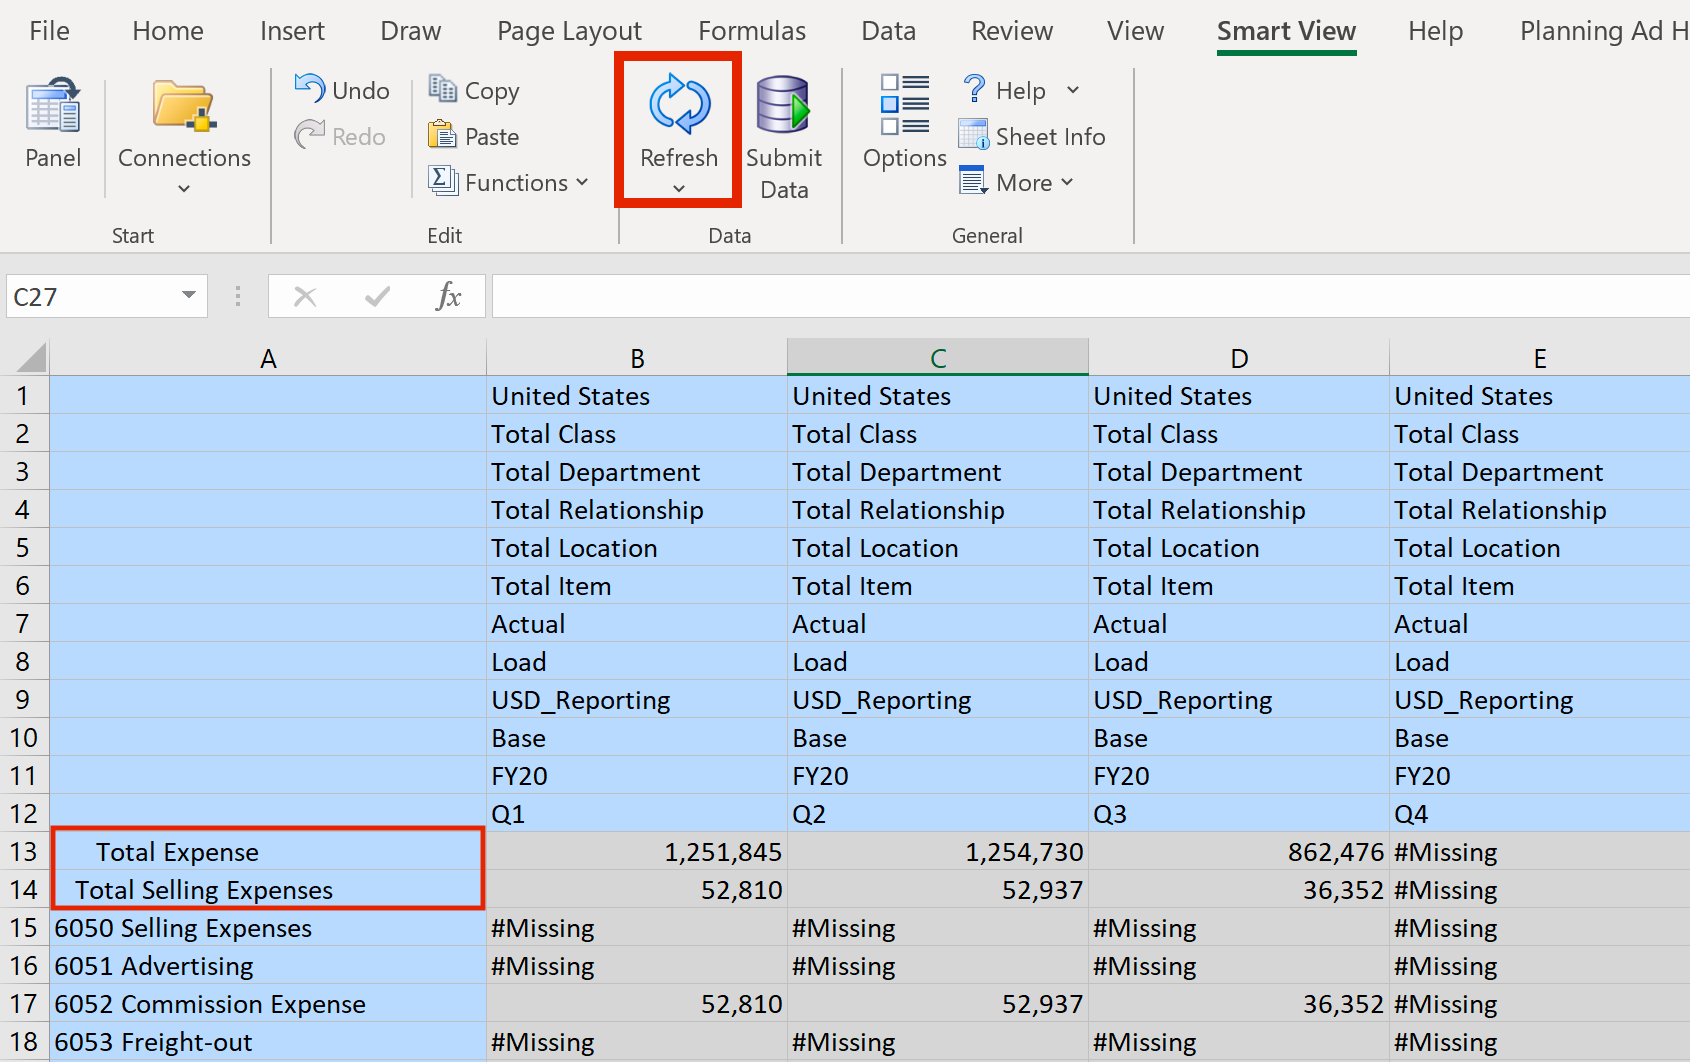
Notice that the totals, including Total Expense and Total Selling Expense, are now indented.
4. Data Options: this is where you specify how rows and columns are displayed in ad hoc grids. You can choose which data rows and/or columns to suppress from Supress Rows and Suppress Columns menus. You can also choose the value to display when there is no data from Replacement menu.
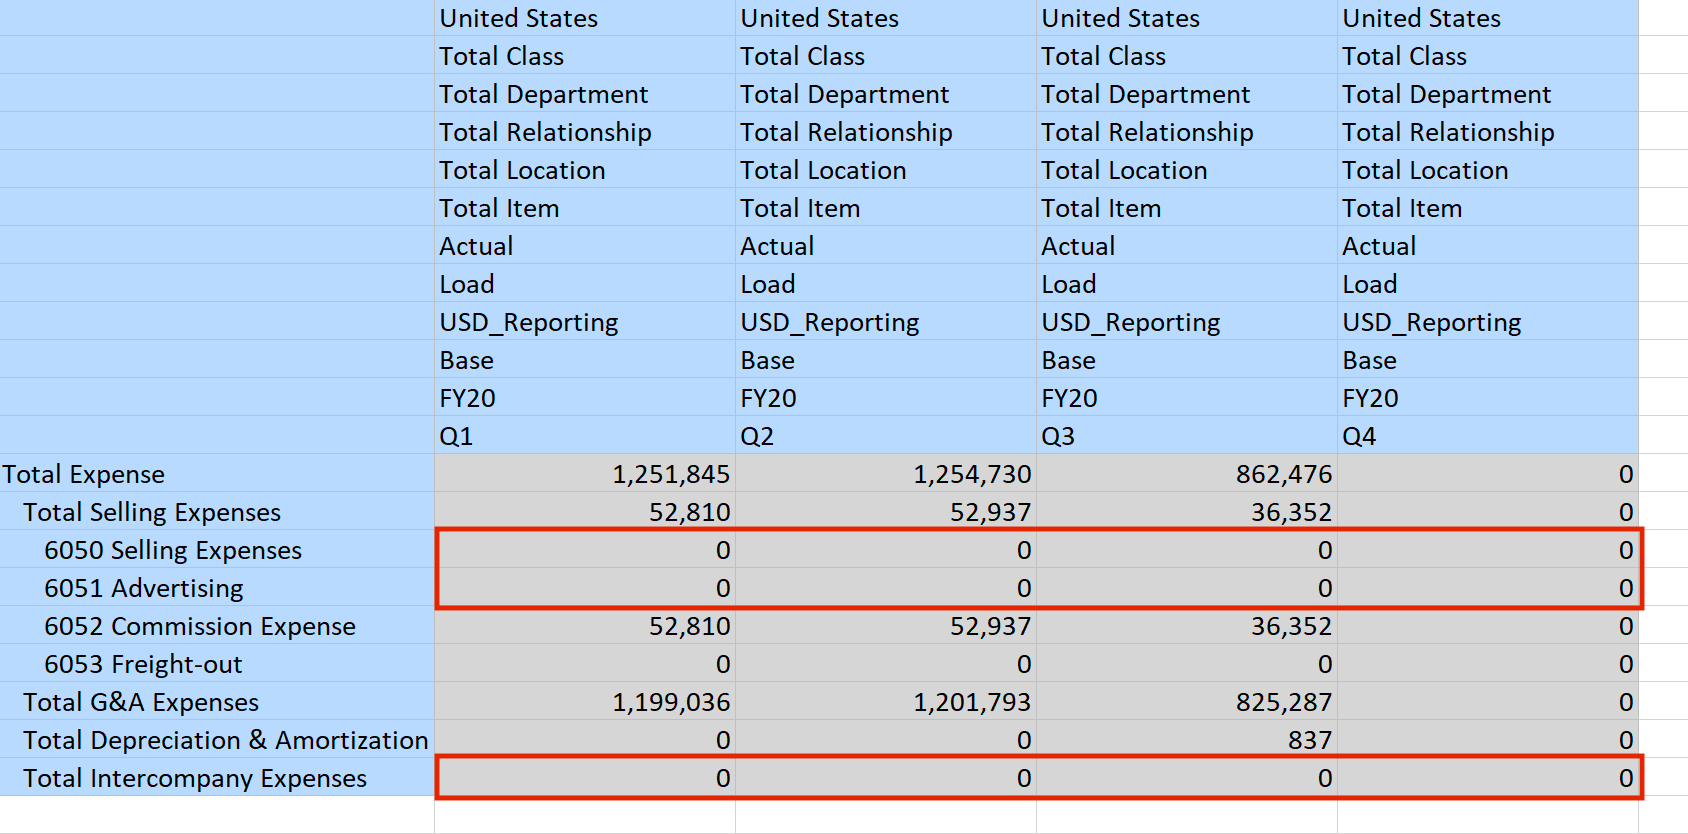
For example, as you expand your ad hoc grid by adding rows and columns, you may see cells that are labeled #Missing. This is the default value in Smart View when no data exists. To change how missing values are displayed in your worksheet, from Data Options menu, toggle #NoData/Missing Label from #Missing to #NumericZero. Click OK and refresh the worksheet.
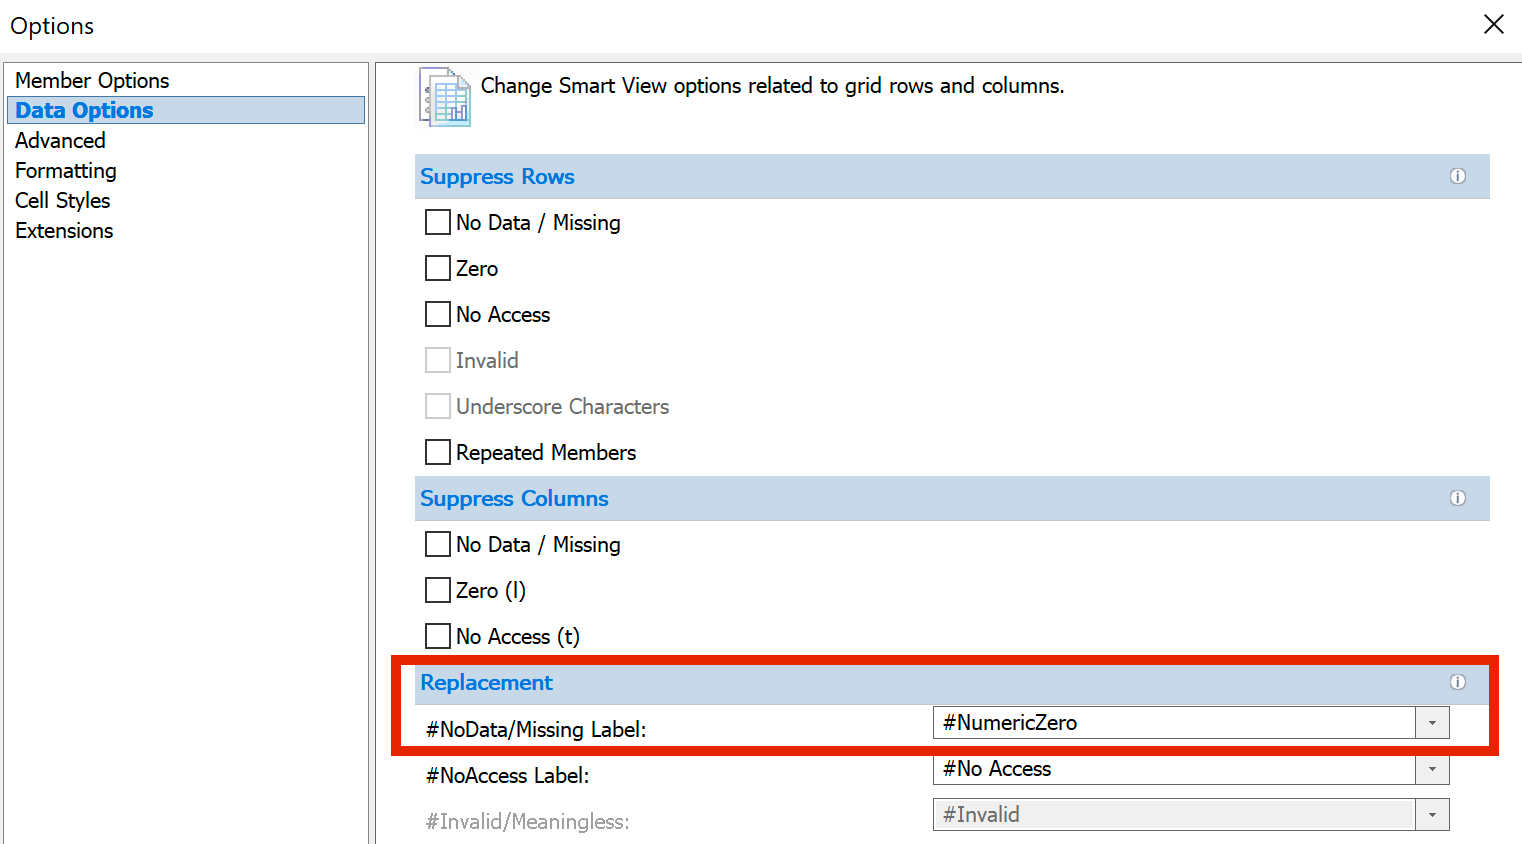
All #Missing values in the ad hoc grid are now replaced with numeric zeros. Note that you can also replace #Missing with a dash "-", "N/A", or any other custom value that you like.
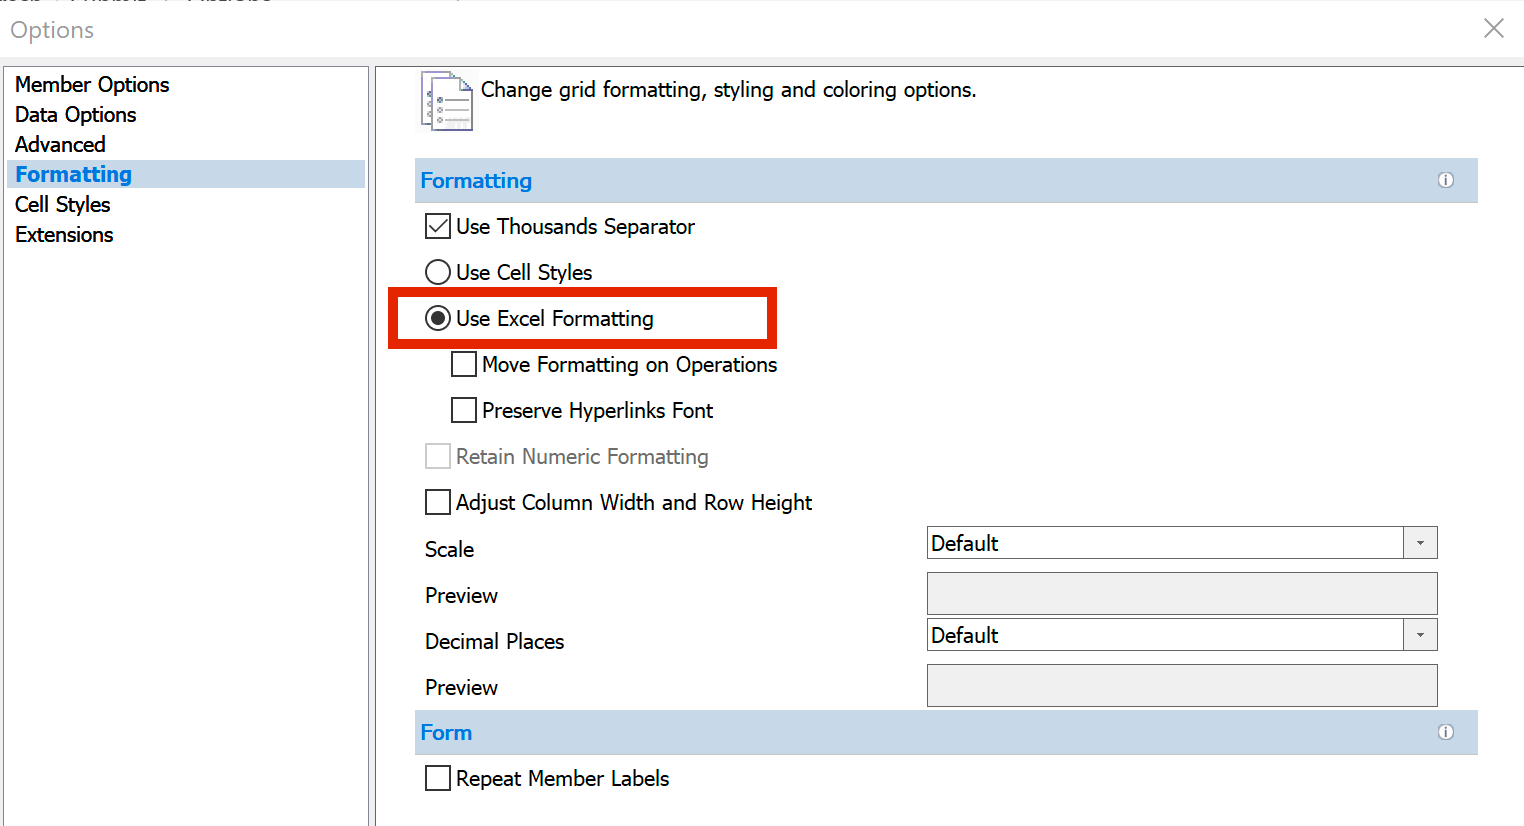
5. Formatting: this is where you set formattting options to define number formatting. You can specify a thousand sepeartor. You can choose whether to apply the defined Cell Styles or use Excel Formatting. You can choose to automatically adjust the column width and row height to fit the cell contents. And you can also adjust the scale an decimal places of the data.
For example, if you don't want to use Smart View Cell Styles, you can choose Use Excel Formatting and customize your ad hoc grid formatting.
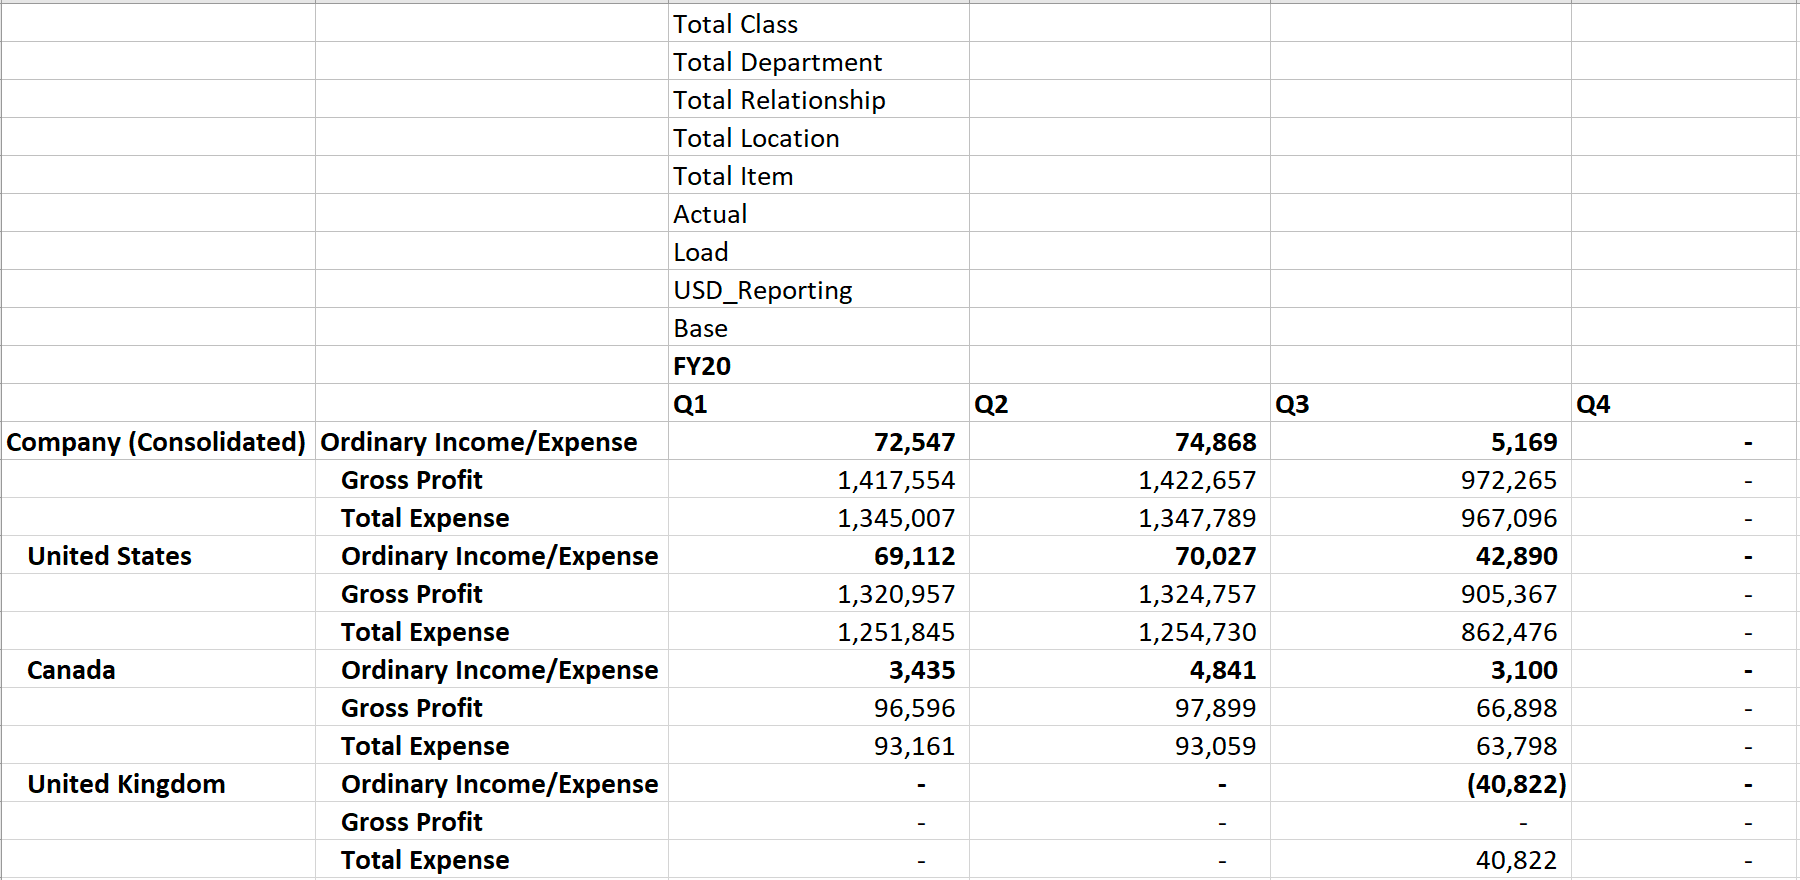
After applying your own Excel formatting to your ad hoc grid, you can refresh the sheet and the formatting remains intact.
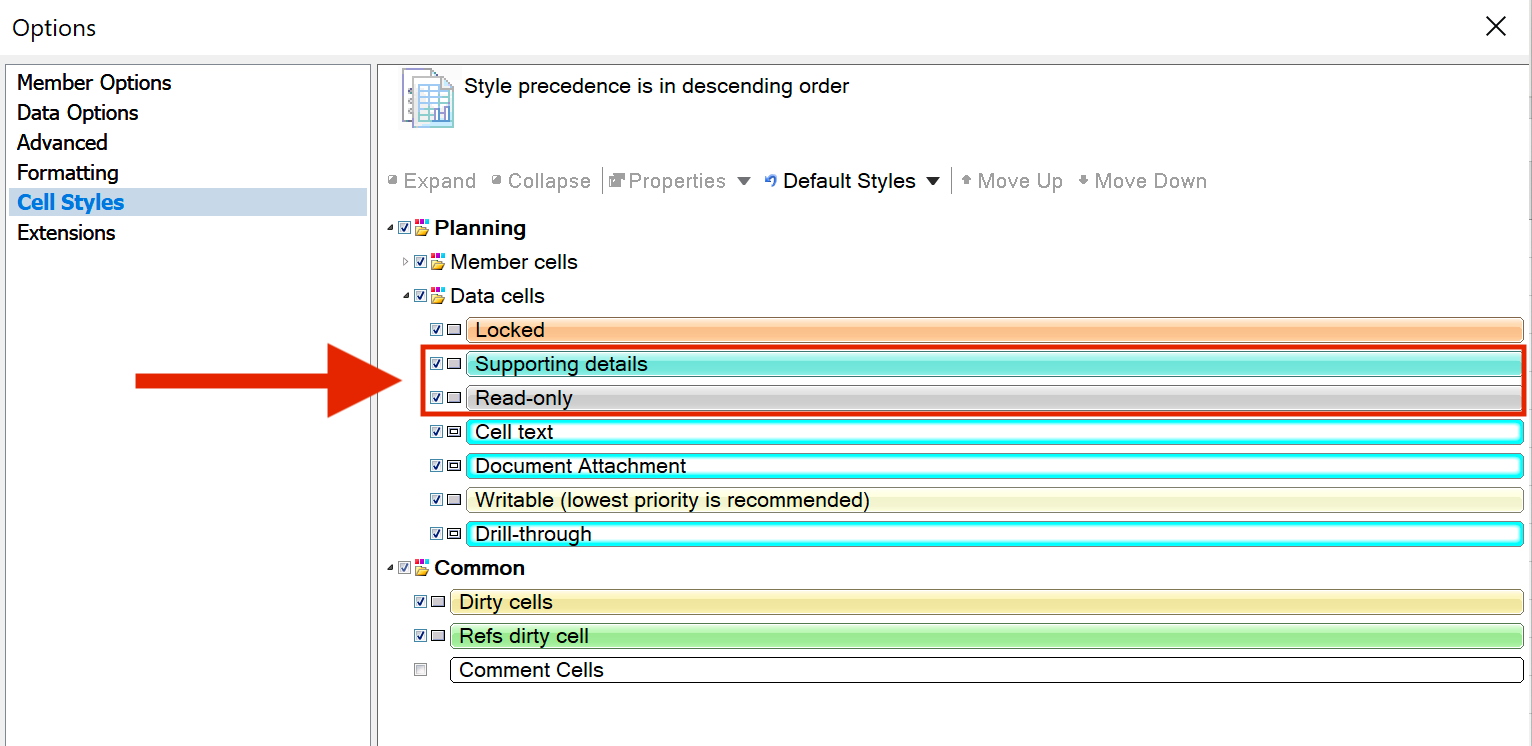
6. Cell Styles: this is where you specify cell styles to apply visual cues such as font, cell color, and border format. You can expand on Planning, Member cells, Data cells, and Common to see many formatting options that you can apply to your ad hoc grid.
For example, read-only cells are displayed in gray, just like how our examples are showing in this blog post. Or cells with supporting details are displayed in teal.
In this post, we've shown you how to create more advanced ad hoc report by setting your formatting options Smart View. Stay tuned for more Smart View tips and tricks.
Want to Learn More?
If you would like a free consultation please contact Gerard at Redhill Business Analytics via email or the contact form below.