
Welcome to an overview of NetSuite Planning and Budgeting Cloud. In this post, we'll show you how to access the environment and walk through the general features and benefits of the Planning and Budgeting Cloud (NSPB/PBCS).
Accessing the Environment
1. Login to your PBCS environment using your credentials.
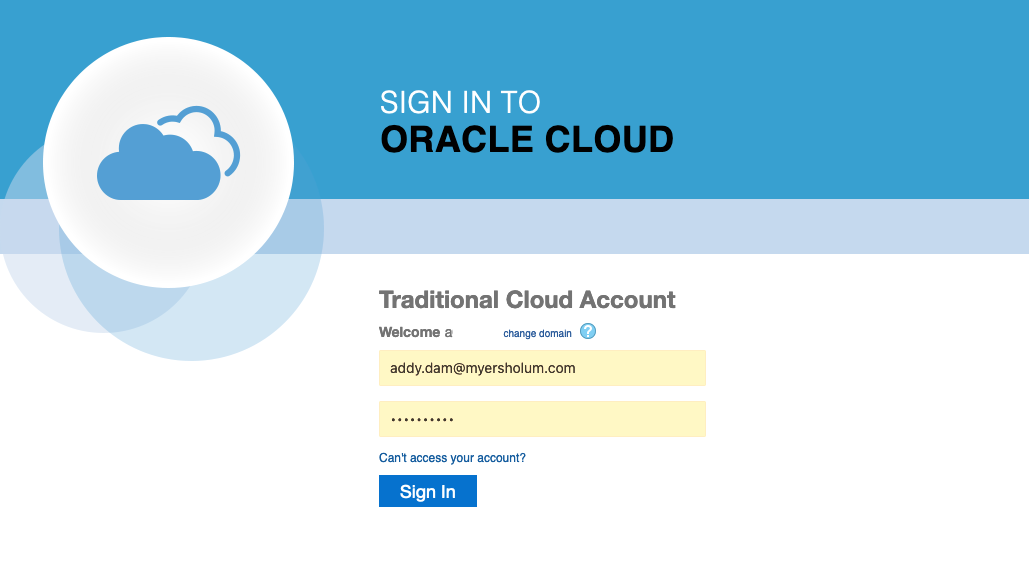
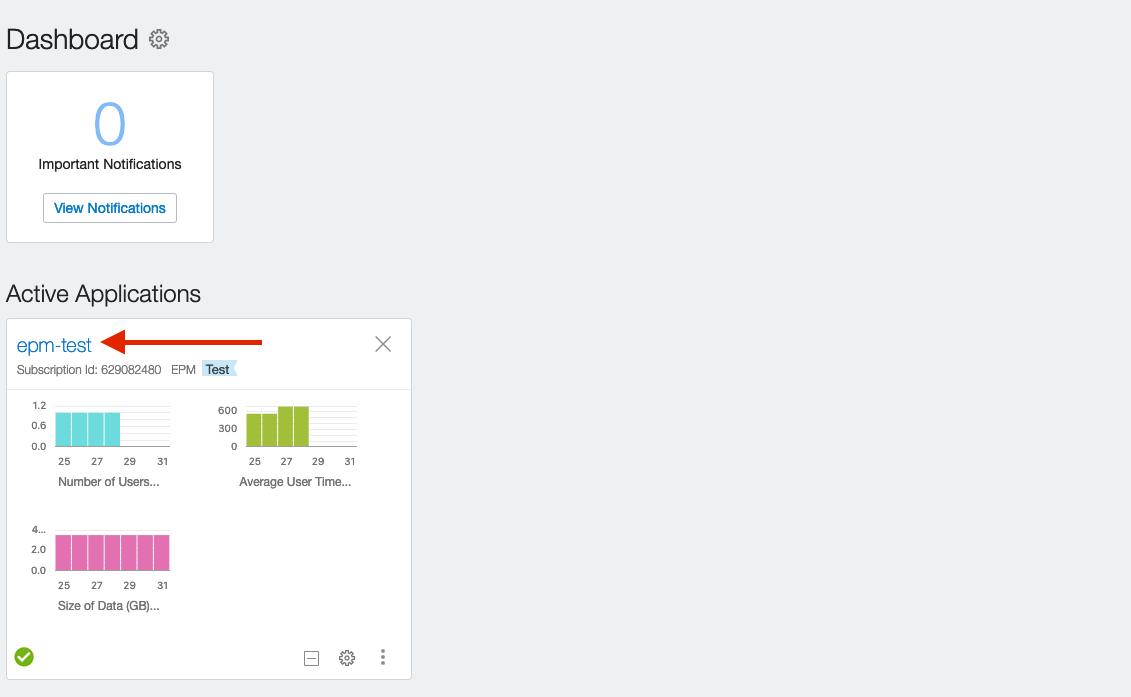
2. Click on the environment/identity domain you'd like to enter. Below example is a Test environment but sometimes you can have both Test and Production environments.
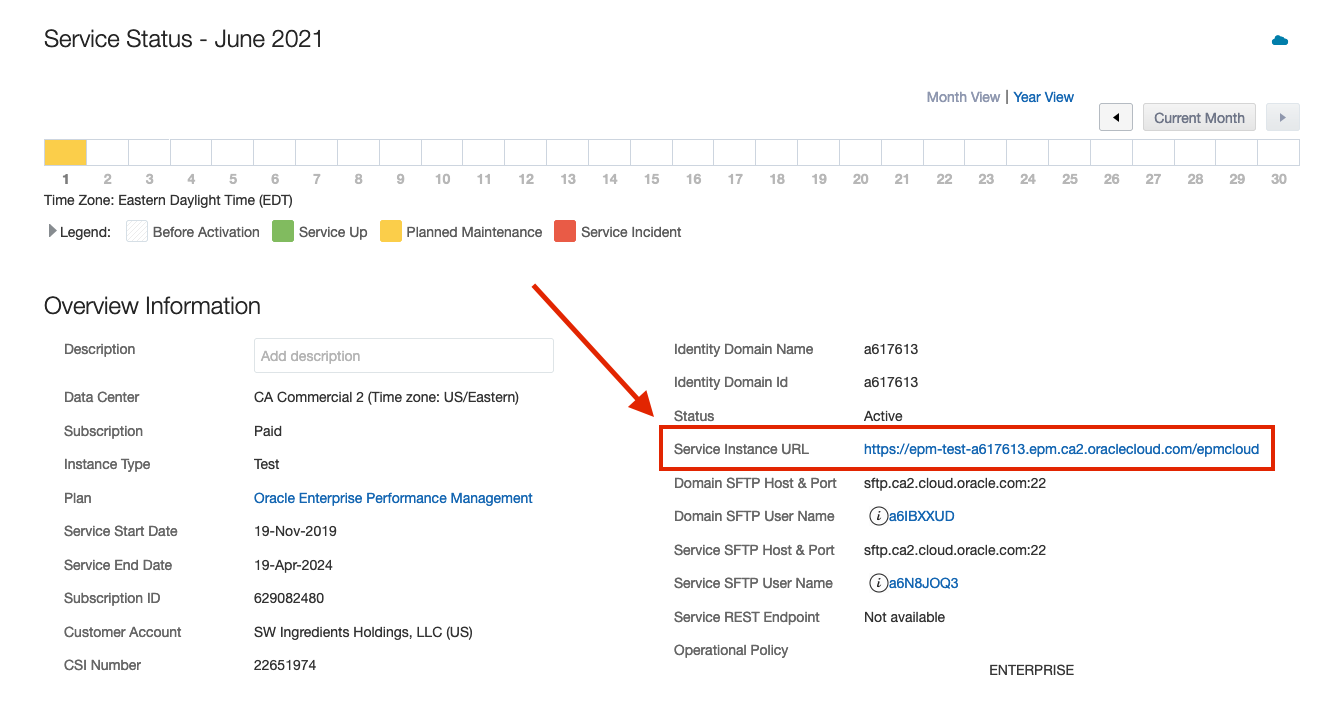
3. Click on the Service Instance URL to enter the environment.
PBCS Navigation Flow
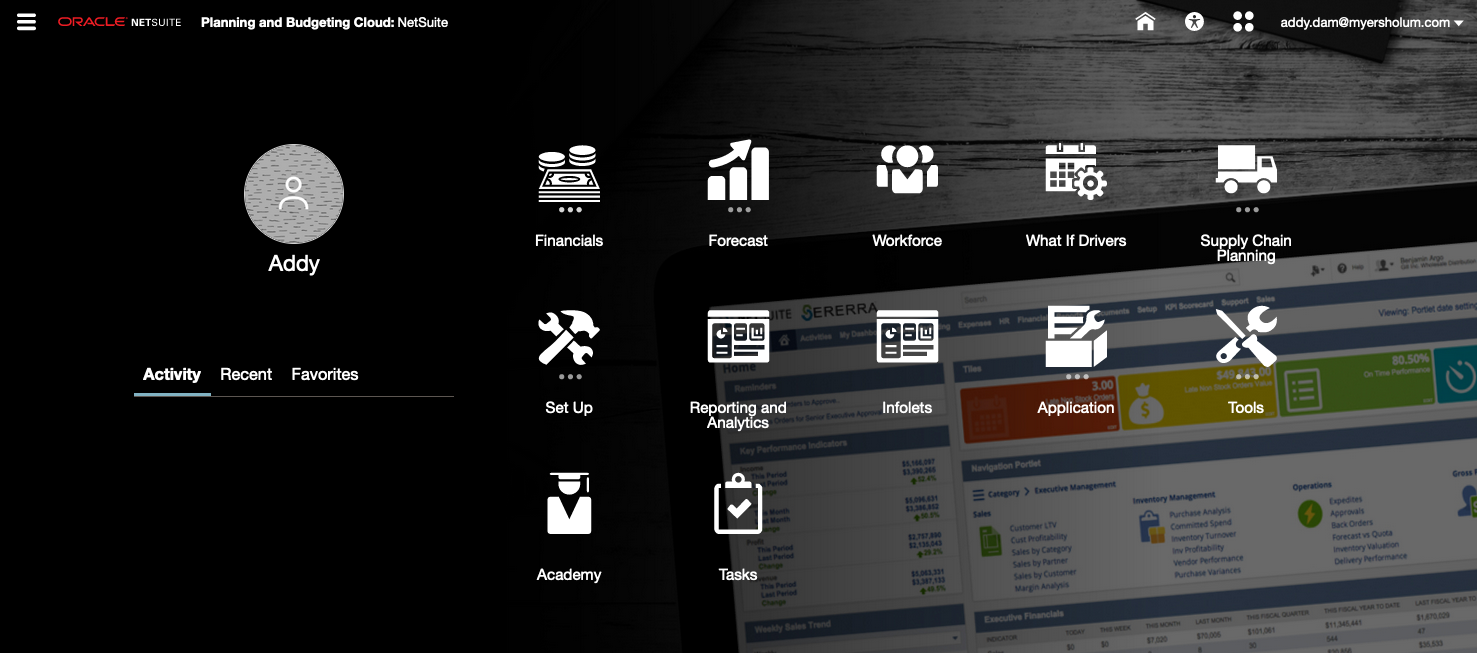
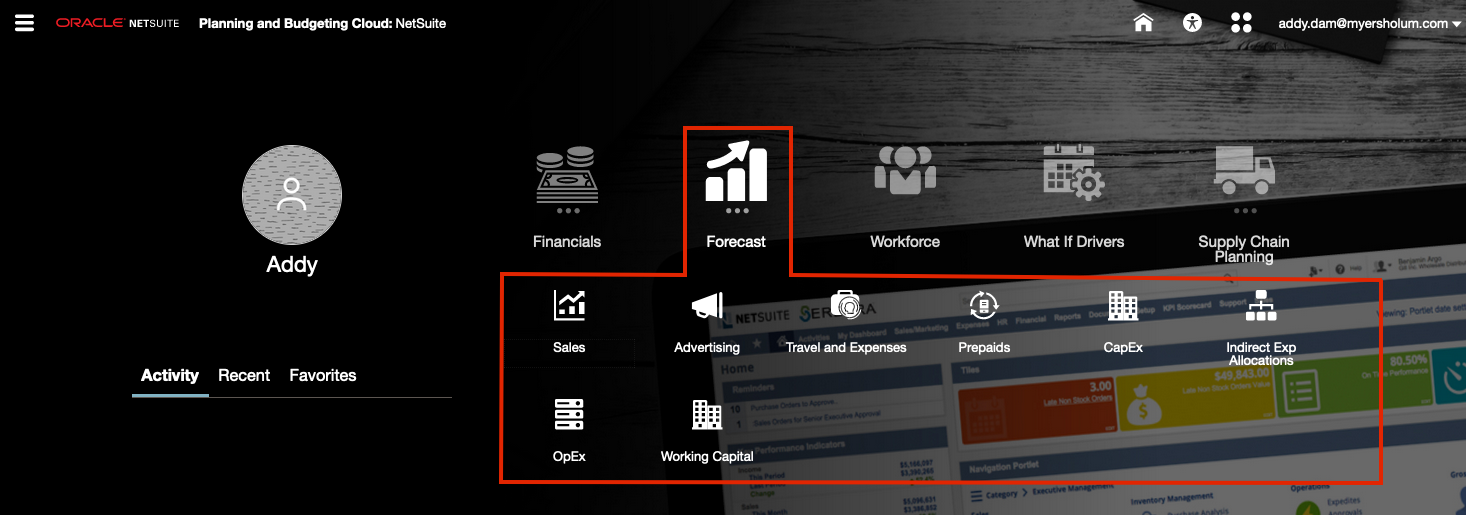
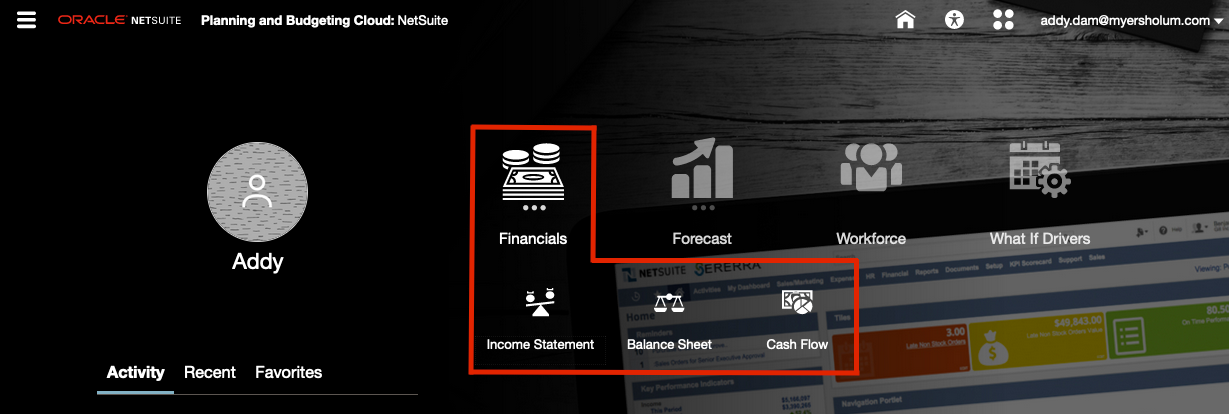
The homepage of PBCS contains cards offering one-click access to various functional areas of the business process. A cluster is a grouping of cards. Each card navigates users to the corresponding area, where information is displayed as one or more tabbed pages. In our Demo environment below, Financials and Forecast are clusters while Workforce and What If Drivers are cards.
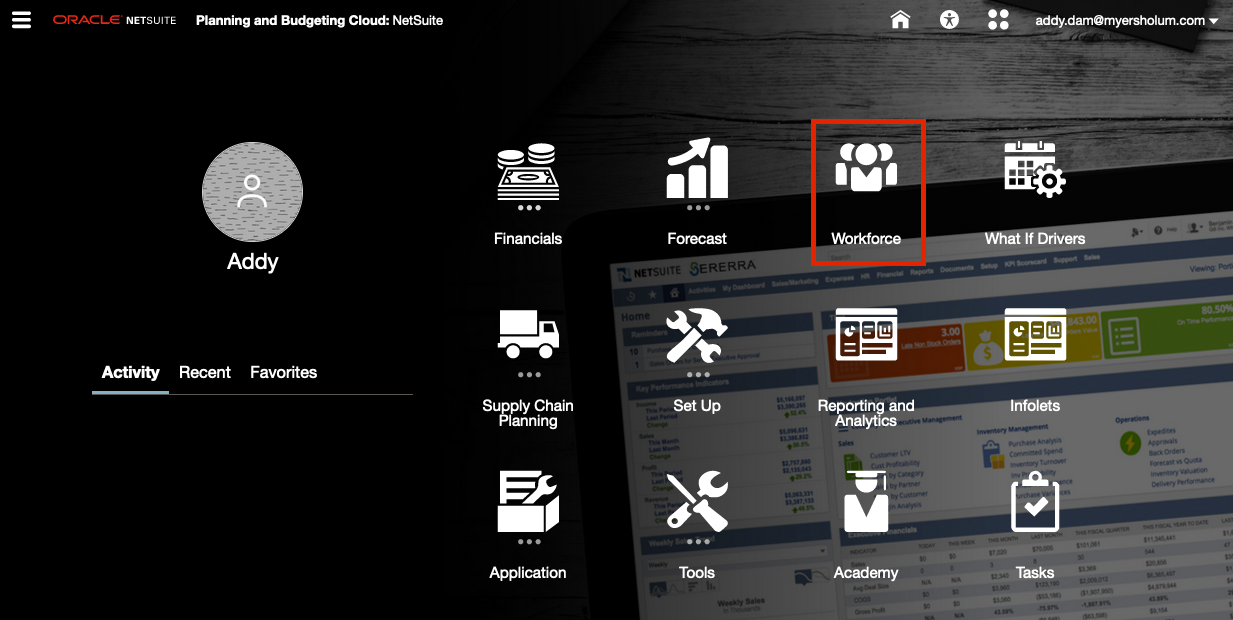
Workforce
1. From the home page, click the Workforce card.
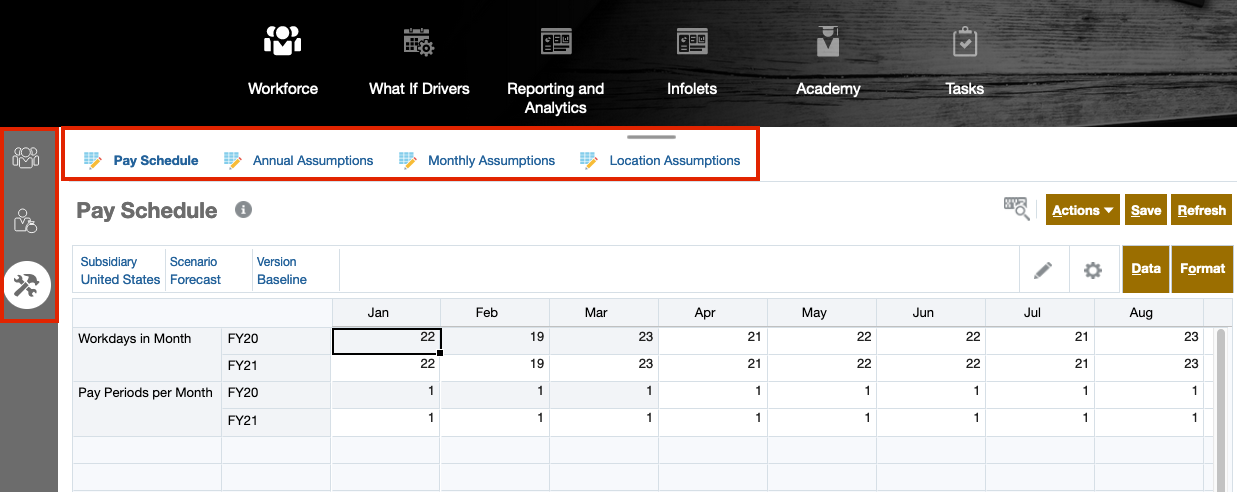
2. Workforce is an example of a tabular card displaying multiple pages, both vertically and horizontally.
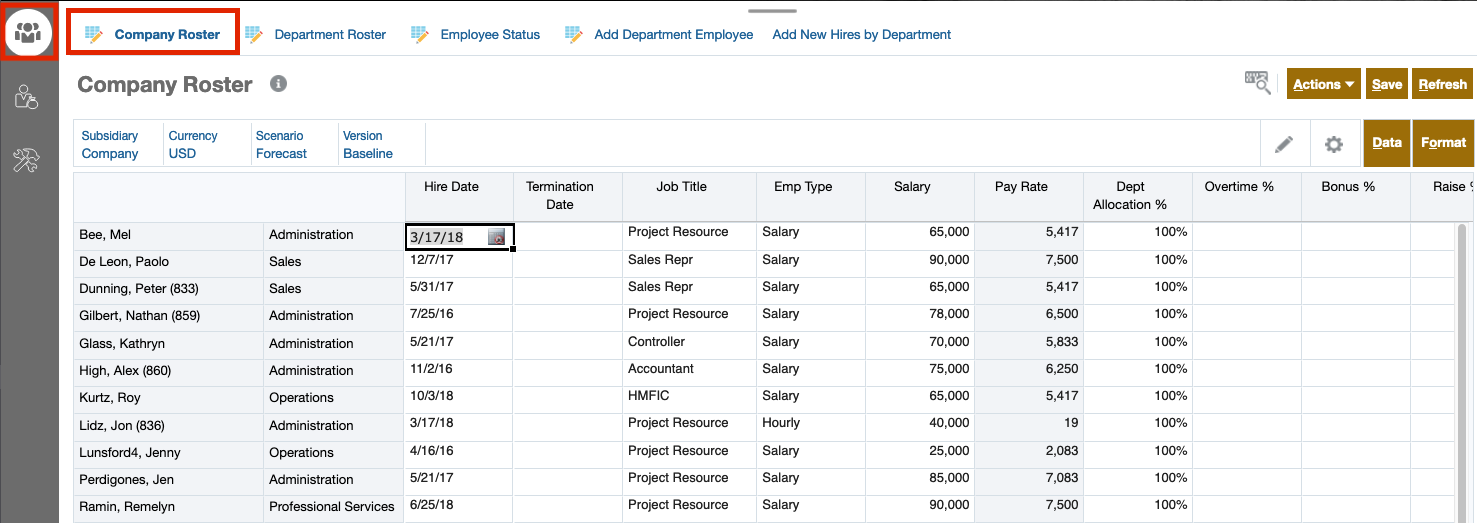
3. In Company Roster, you can review your current employee details as well as make adjustments to a specific employee to test the operational and financial impact. You can also review how staffs are organized across departments.
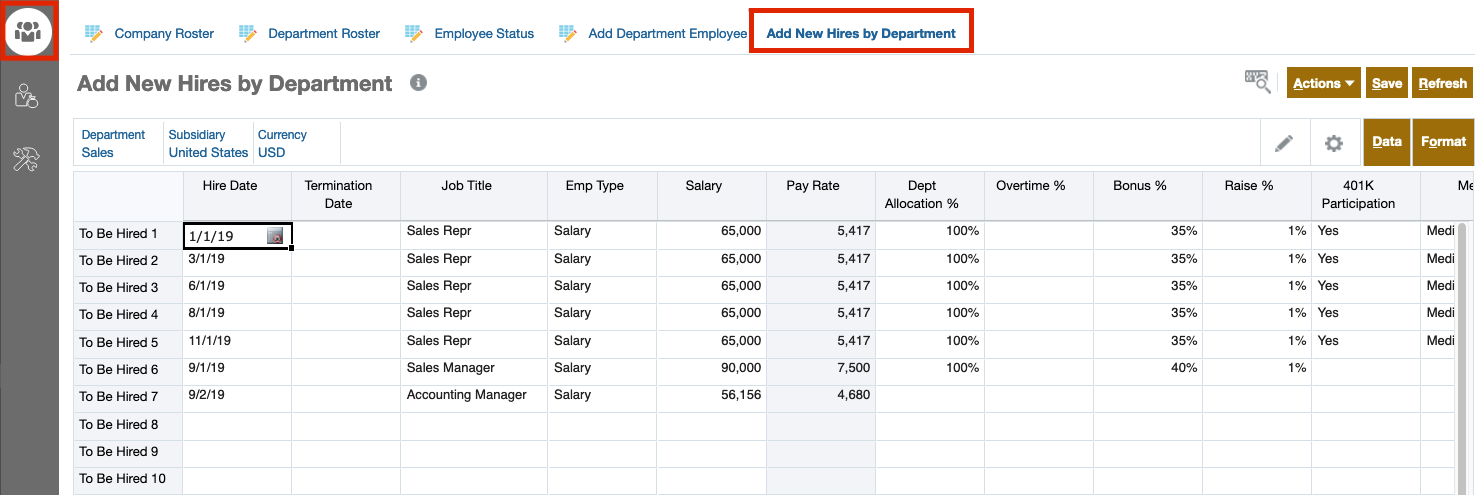
4. In Add New Hires by Department, you have the option of adding additional headcounts to the departments so you can model the potential impact.
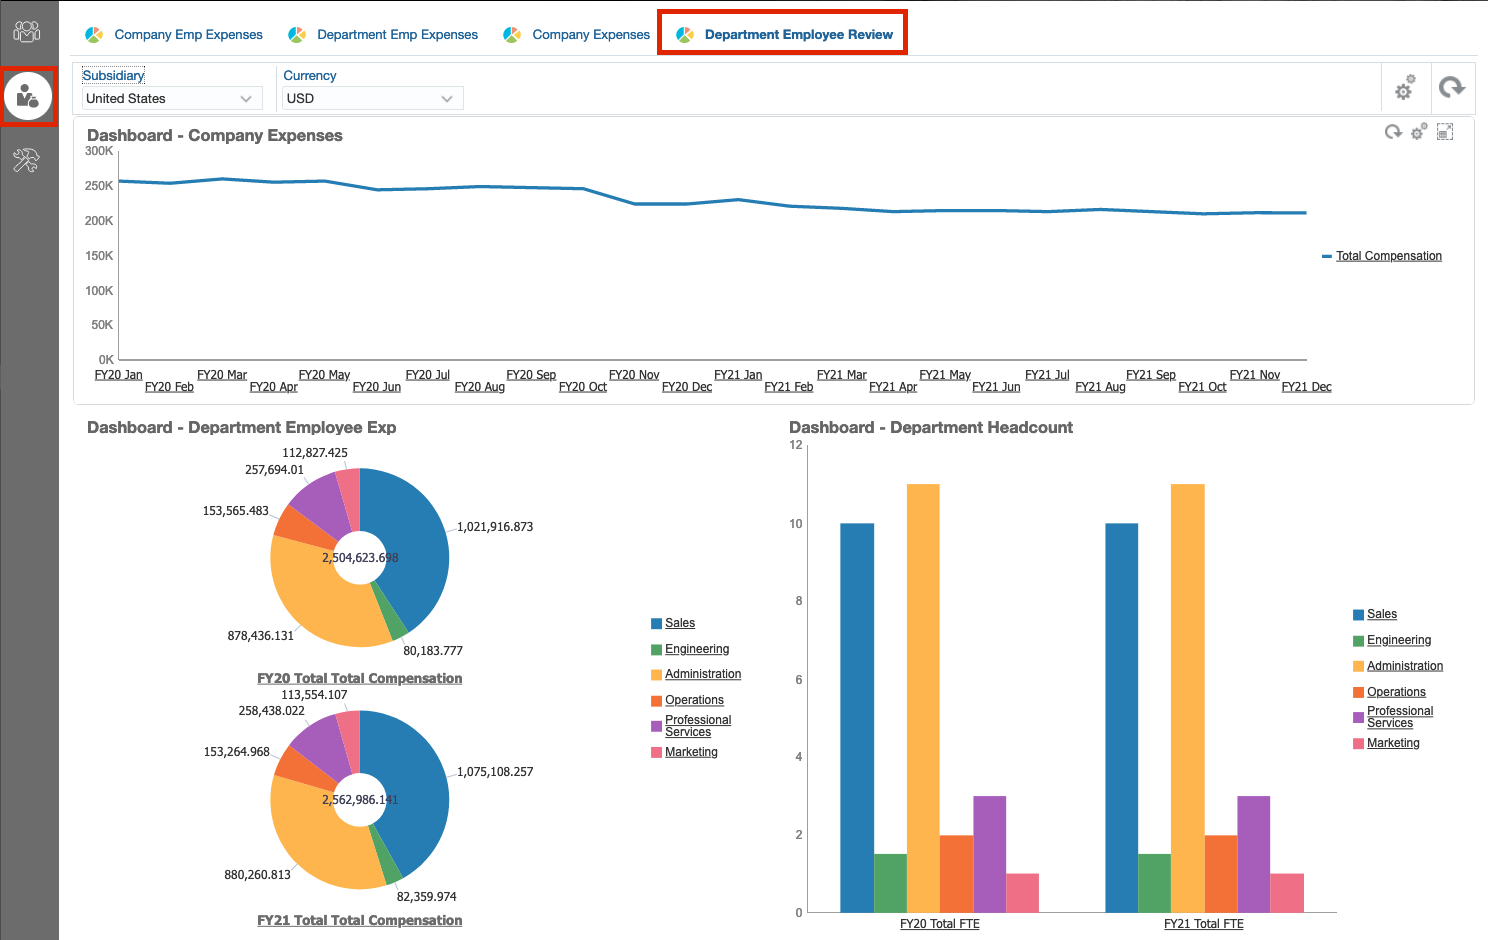
5. Using dashboards such as Department Employee Review, you have the ability to visually analyze trends and drill down on lower-level details.
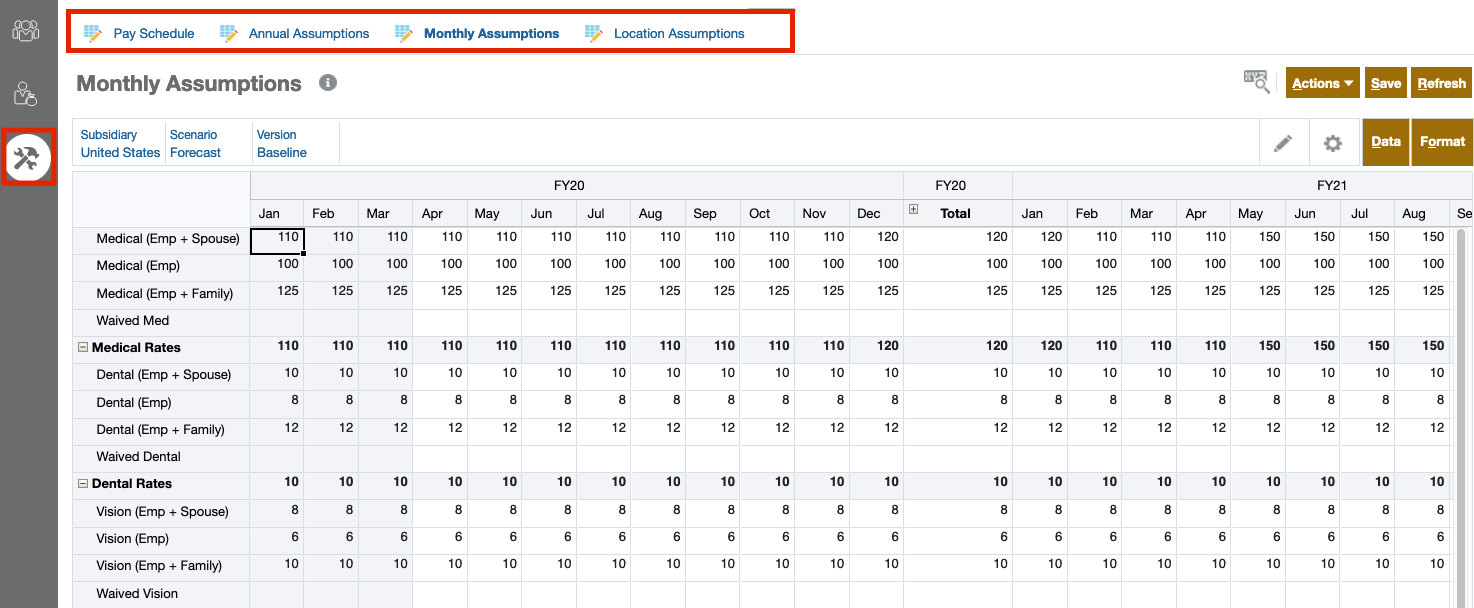
6. You can also set up your Workforce by inputting Pay Schedule, Annual Assumptions, Monthly Assumptions, and Location Assumptions.
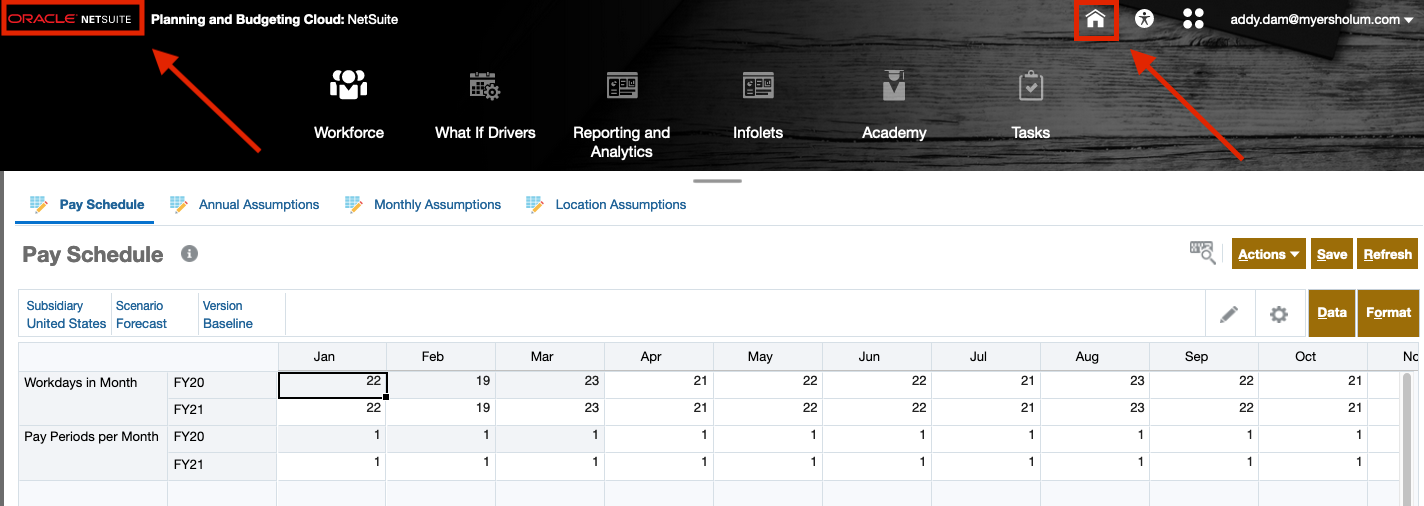
7. Click the Home button in the top right or the company logo in the top left anytime to navigate back to the home page.
Forecast
1. Click the Forecast cluster to gain access to a variety of modules containing pre-configured logics, designed to simplify the process of forecasting various revenue and expense items.
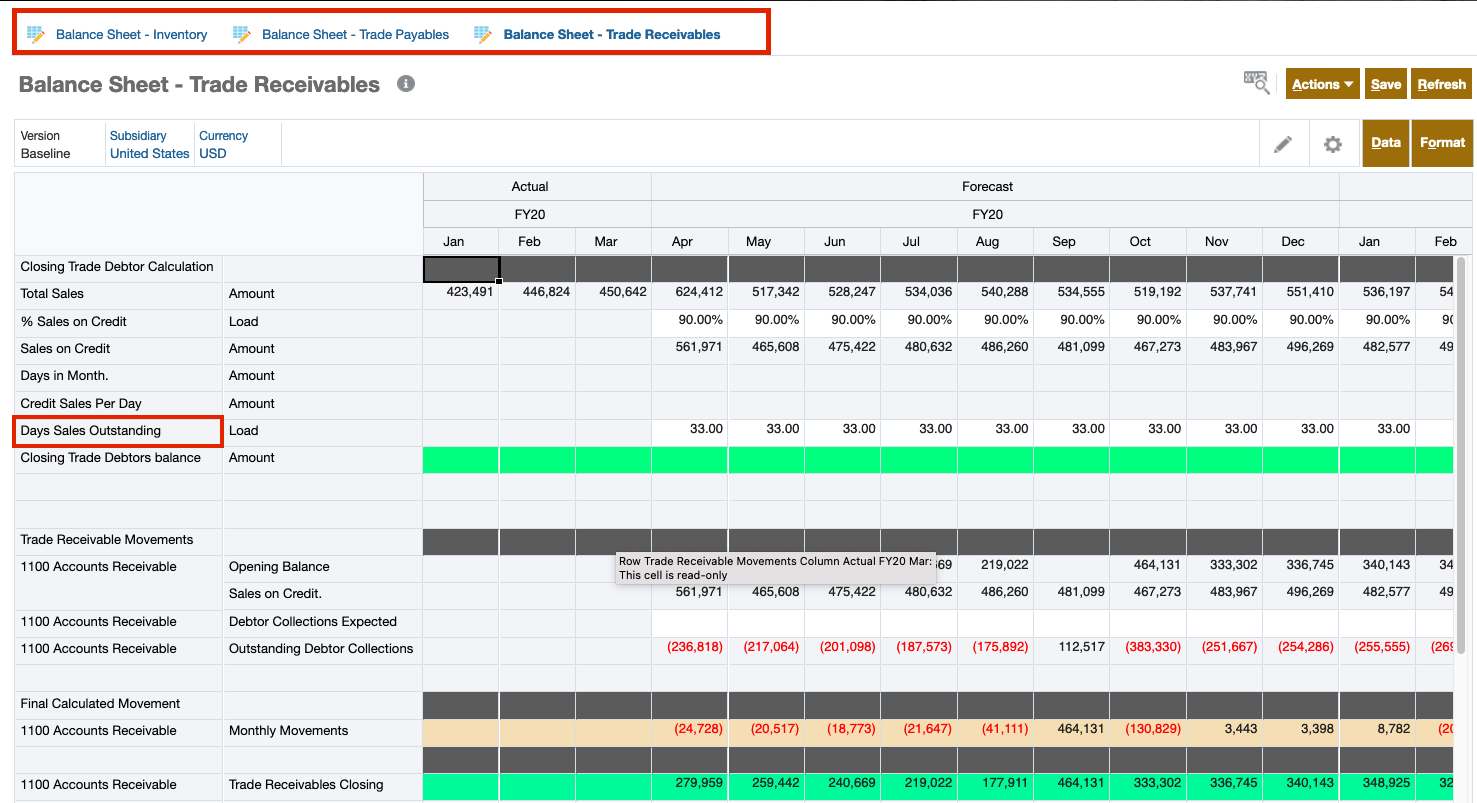
2. Working Capital card presents forms allowing you to leverage built-in calculations to forecast Inventory, Trades Payables, Trade Receivables, using common financial metrics such as Days Inventory Outstanding, Days Payable Outstanding, and Days Sales Outstanding.
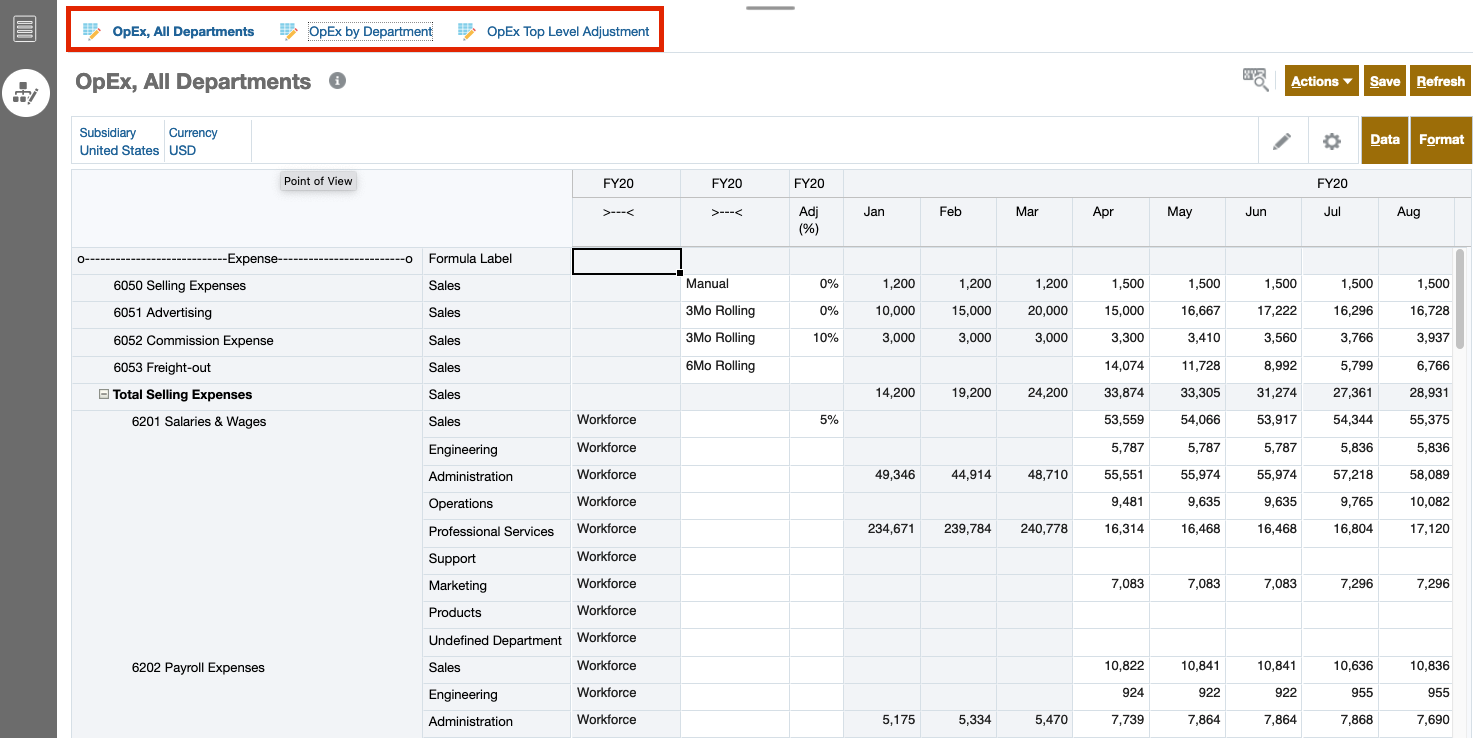
3. OpEx card presents OpEx planning forms allowing you to input driver such as Adjustment % to forecast OpEx as well as input expense by Account and by Department.
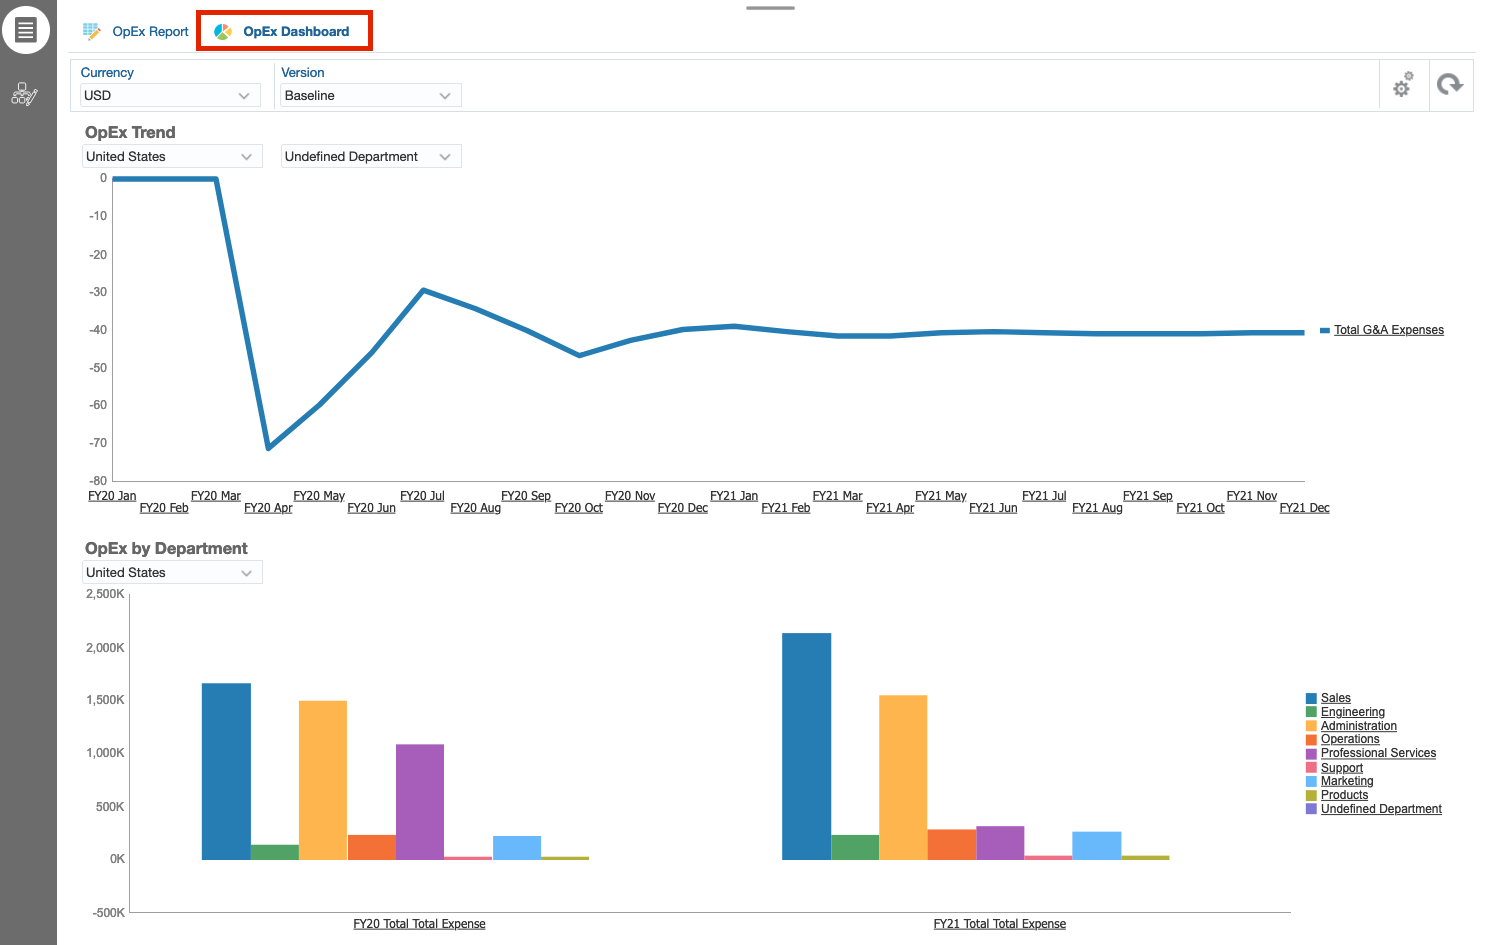
4. OpEx Dashboard provides visualization into OpEx trend and allocation by Subsidiary and by Department over the year. You can also customize the dashboards to yield more insights for the business.
Financials
1. Click the Financials cluster to access up to date financial statements such as Income Statement, Balance Sheet and Cash Flow report.
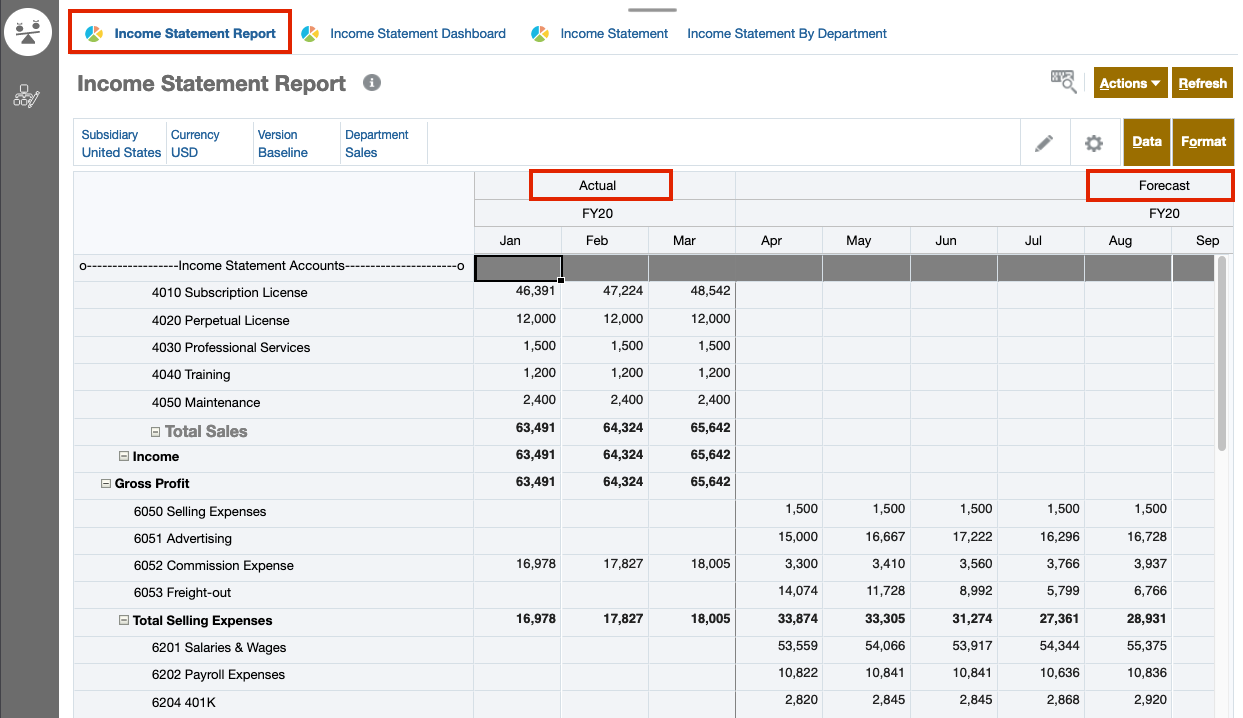
2. The Income Statement Report shows a trended view of different scenarios, from Actual to Forecast.
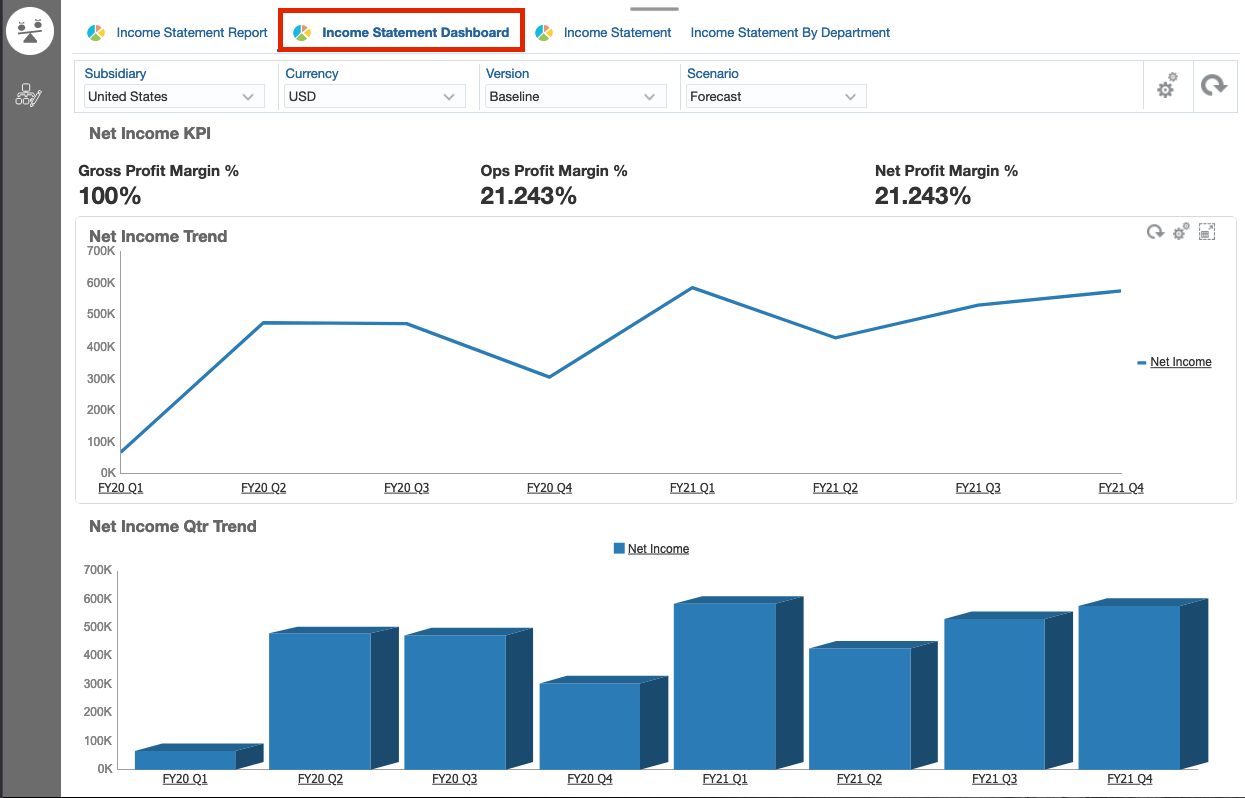
3. While Income Statement Dashboard shows trended graphs with ability to drill down to lower-level details.
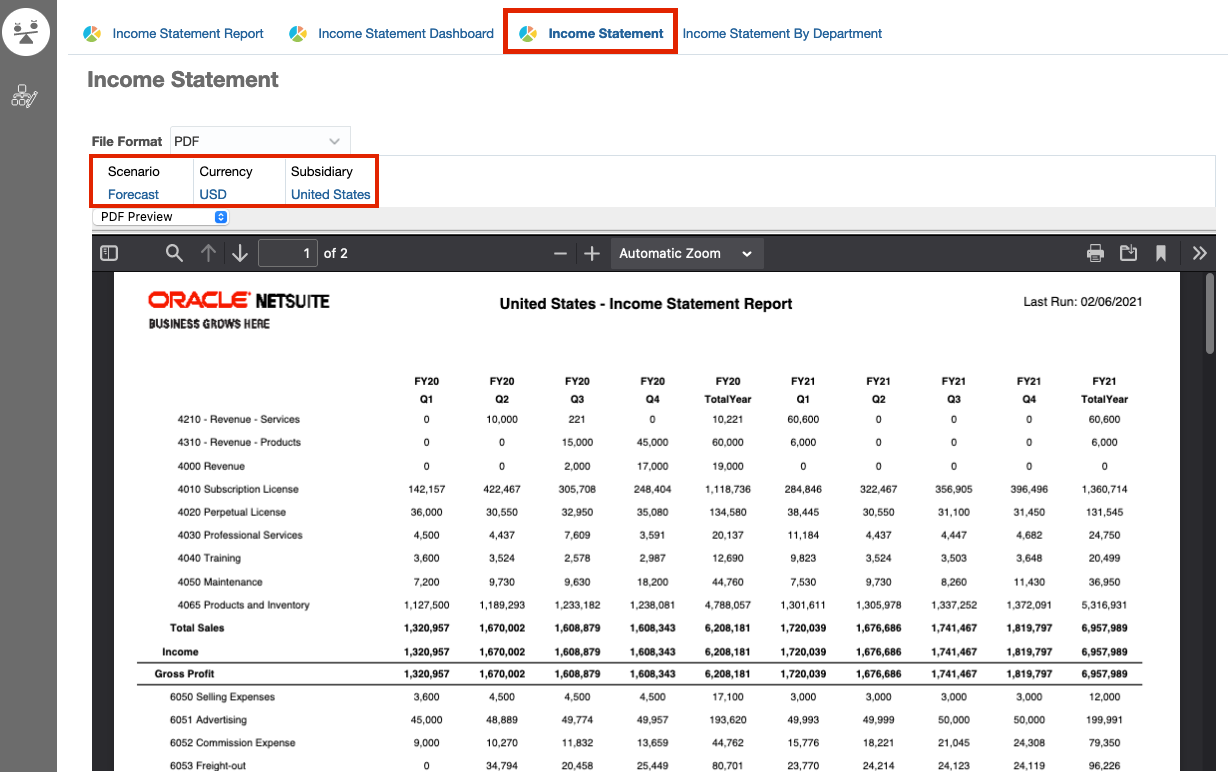
4. You can also view dynamic reports created in Reporting Web Studio (also known as Hyperion Financial Reporting Web Studio), with selectable point of view, where you can toggle between different Scenario, Subsidiary, Department, etc.
Want to Learn More?
If you would like a free consultation please contact Gerard at Redhill Business Analytics via email or the contact form below.